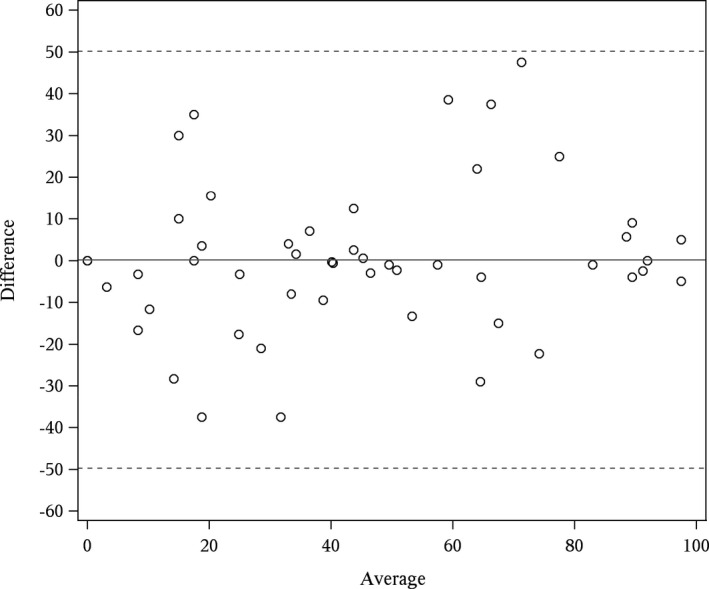
Figure 5.

Bland–Altman plot of patient‐level confidence for intrarater readings. The x‐axis is the mean of the two patient‐level confidence scores (e.g., the first and second reading) and the y‐axis is the difference in the two patient‐level confidence scores. The estimated mean difference (bias) in confidence (first reading minus second) was 0.19. Dashed lines are ±2 standard deviations of the difference.
