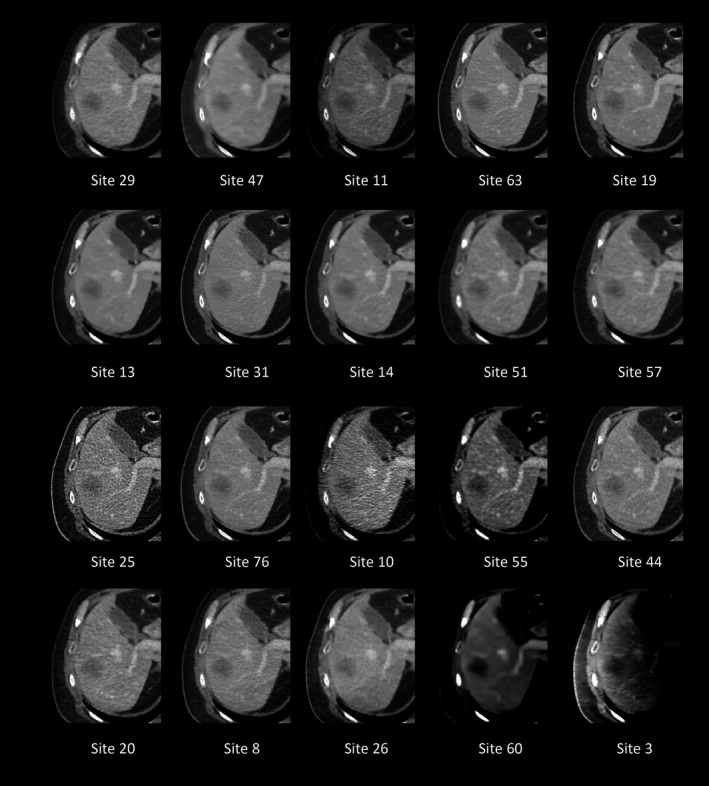
Figure 7.

The same image slice is shown for each of the 20 sites. Images are in order of final ranking. This figure demonstrates the range of visual impressions submitted by participants. Of note is the particularly poor quality of some of the lower ranking sites.
