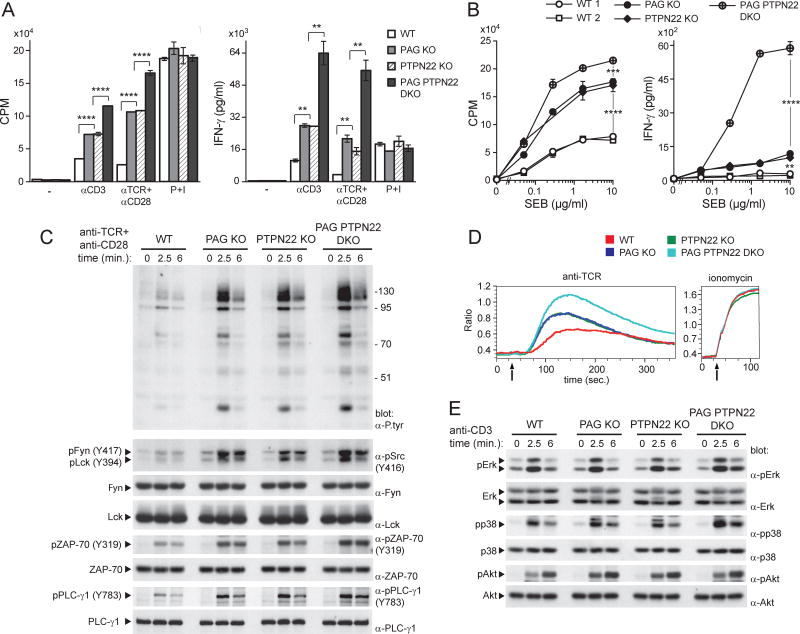
Figure 5. PTPN22 cooperates with PAG to suppress the responses of previously activated T cells.
(A). Previously activated CD4+ T cells from WT, PAG KO, PTPN22 KO or PAG PTPN22 DKO mice were stimulated with the indicated antibodies or P+I, as in Figure 1A. Proliferation and IFN-γ production were monitored. Means with SD of triplicates are shown. (B). Same as in (A), except that cells were re-stimulated with the indicated concentrations of SEB and APCs. (C). Previously activated CD4+ T cells from the indicated mice were stimulated for the indicated times with anti-TCR plus anti-CD28. Phosphorylation was then detected by immunoblotting of total cell lysates with antibodies against P.tyr (first panel), activated Src kinases (second panel), activated ZAP-70 (fifth panel) or tyrosine phosphorylated phospholipase C (PLC)-γ (seventh panel). The positions of molecular mass markers are shown on the right. (D). Calcium fluxes in previously activated T cells were analyzed as detailed for Figure 2C. (E). Same as in (C), except that total cell lysates were probed by immunoblotting with the indicated antibodies. **p<0.01; ***p<0.001; ****p<0.0001. Representative of n = 2 (A), n = 2 (B), n = 3 (C), n = 2 (D) and n = 3 (E). Related to Figure S4.

