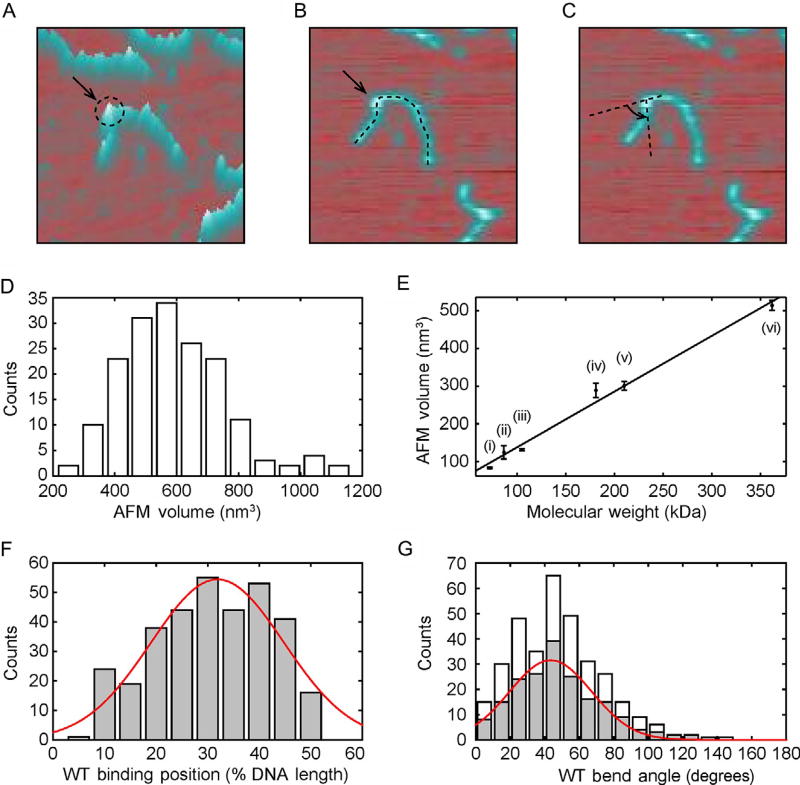
Fig. 4.
AFM imaging of protein volume, position, and bend angle. (A)–(C) AFM images of each protein-binding event on DNA can be used to extract information on the protein volume, binding position, and DNA bend angle, respectively. (D) Histogram of UV-DDB K244E mutant volumes on DNA (n = 171). (E) Calibration curve relating the molecular weight of a complex to its measured AFM volume, mean ± SD of three separate determinations. The curve was generated using the following proteins in solution: (i) Pot1 monomer (65 kDa), (ii) PcrA monomer (86.4 kDa), (iii) UvrA monomer (105 kDa), (iv) Taq MutS dimer (181 kDa), (v) UvrA dimer (210 kDa), and (vi) Taq MutS tetramer (362 kDa). Linear fit to the data yields V(nm3) = 1.471 MW (kDa) − 7.294 with R2 = 0.9886. (F) Histogram and Gaussian fitting (red curve) of wild-type Rad4–Rad23-binding positions (32% ± 13%, n = 335) on 538 bp DNA fragment in terms of percentage of total contour length measured from one end. (G) Histogram of DNA bend angles at all internal wild-type Rad4–Rad23-binding sites (white, n = 335). The histogram (gray) and Gaussian fitting (red curve) show DNA bend angles (43 ± 24°, n = 189) at specific binding events (proteins bound between 20% and 40%). Panel (D): Adapted with permission from Ghodke, H., Wang, H., Hsieh, C. L., Woldemeskel, S., Watkins, S. C., Rapic-Otrin, V., et al. (2014). Single-molecule analysis reveals human UV-damaged DNA-binding protein (UV-DDB) dimerizes on DNA via multiple kinetic intermediates. Proceedings of the National Academy of Sciences of the United States of America, 111(18), E1862–E1871. http://dx.doi.org/10.1073/pnas.1323856111 (fig. 5E). Panel (E): Adapted with permission from Ghodke, H., Wang, H., Hsieh, C. L., Woldemeskel, S., Watkins, S. C., Rapic-Otrin, V., et al. (2014). Single-molecule analysis reveals human UV-damaged DNA-binding protein (UV-DDB) dimerizes on DNA via multiple kinetic intermediates. Proceedings of the National Academy of Sciences of the United States of America, 111(18), E1862–E1871. http://dx.doi.org/10.1073/pnas.1323856111, fig. S6D. Panel (F): Adapted with permission from Kong, M., Liu, L., Chen, X., Driscoll, K. I., Mao, P., Bohm, S., et al. (2016). Single-molecule imaging reveals that Rad4 employs a dynamic DNA damage recognition process. Molecular Cell, 64(2), 376–387. http://dx.doi.org/10.1016/j.molcel.2016.09.005 (fig. 5A). Panel (G): Adapted with permission from Kong, M., Liu, L., Chen, X., Driscoll, K. I., Mao, P., Bohm, S., et al. (2016). Single-molecule imaging reveals that Rad4 employs a dynamic DNA damage recognition process. Molecular Cell, 64(2), 376–387. http://dx.doi.org/10.1016/j.molcel.2016.09.005 (fig. 5B).

