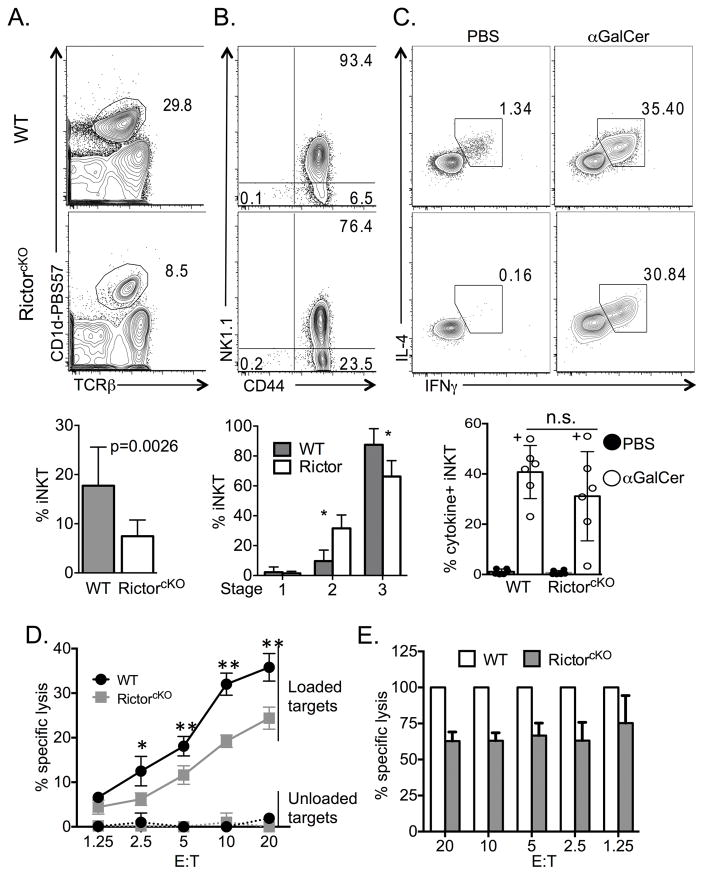
Figure 5. Rictor is required for development and cytolytic function of liver iNKT-cells.
A. Representative live singlet, TCRβ+ CD1-PBS57 profile of WT and RictorcKO liver lymphocytes and compiled frequencies of iNKT liver lymphocytes from 8 experiments, with 2–3 mice per experiment, n=8–9 mice total per genotype, unpaired t-test mean ± S.D. B. CD44 and NK1.1 profile of liver live singlet, TCRβ+ CD1-PBS57, CD24− cells and compiled frequencies of Stage 1–3 iNKT-cells from 3 experiments, n=4–6 mice per genotype, multiple t-test mean ± S.D. * p<0.001. C. IFN-γ and IL-4 production from liver iNKT-cells following in vivo challenge. Representative cytokine plots and graphs of compiled frequencies of IFN-γ and IL-4 producing iNKT-cells from mice injected with PBS (filled histograms and bars) or α-GalCer (open histograms and bars). “+” denotes data from mice injected with PBS44. Compiled data from 6 independent experiments with n=6 mice per genotype, paired t-test mean ± S.D. D and E. Line graph of percent specific lysis of unloaded or PBS44-loaded targets by NKT-cells sorted from WT or RictorcKO mice. Analysis by two-way ANOVA/Bonferroni post-test (* p<0.05, ** p<0.01) mean ± S.D of triplicate wells. Line graph (D) is representative of 2 independent experiments and bar graph (E) shows combined data of the specific lysis from RictorcKO iNKT-cells relative to WT; paired t-test mean ± S.D. of all replicate wells, p=0.0001. For each experiment liver lymphocytes from 3 (WT) or 8 (RictorcKO) mice were pooled and sorted for NK1.1+ TCRβ+ cells.

