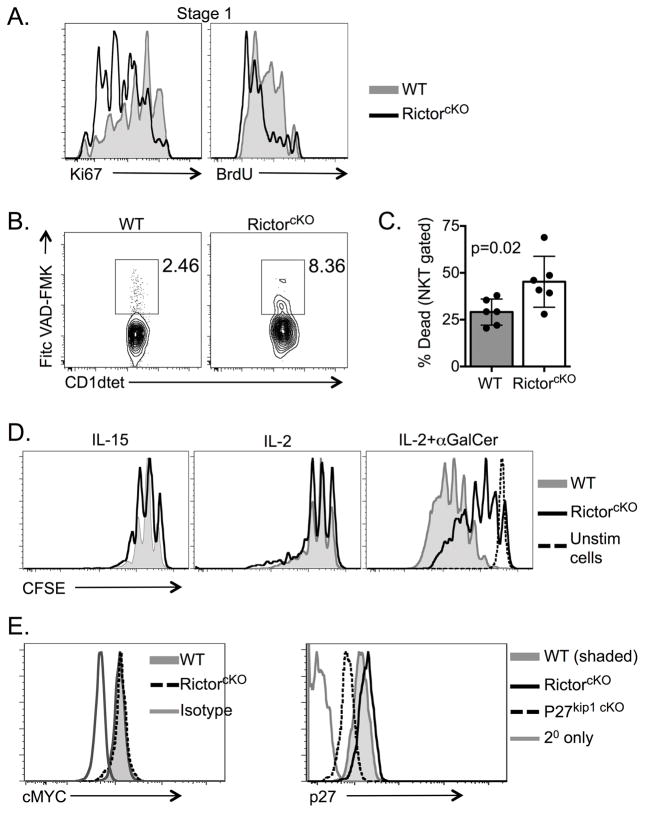
Figure 6. Rictor regulates iNKT-cell proliferation and survival.
A. WT and RictorcKO iNKT-cells in Stage 1 (CD24− NK1.1− CD44−) after Ki76 staining and BrdU incorporation. Data are representative of 2 (BrdU) or 3 (Ki67) independent experiments with 3–7 mice per experiment with a total of 6–7 mice per genotype. B. The frequency of total CD24− iNKT-cells that were caspase+ was determined. Representative of 3 independent experiments with 2–4 mice per experiment and total of 4 mice per genotype, p=0.0114 ratio paired t-test. C. iNKT-cell enriched thymocytes were cultured in media overnight then evaluated for cell survival. Representative plots show dead cells (LIVE/DEAD+) gated on all iNKT-cells after exclusion of doublets. Gating strategy included in Supporting Information. Compiled data are from 6 experiments with 2 mice per experiment total of n=6 mice per genotype, paired t-test mean ± S.D. D. CFSE dilution of live, singlet, iNKT-cells from unfractionated thymocytes cultured for 4 days with the indicated stimuli. Plots representative of 3 independent experiments with 2 mice per experiment. E. Myc and p27kip1 staining of CD24− thymic iNKT-cells from WT, RictorcKO or p27kip1(fl/fl)CD4cre+ (p27kip1 cKO) mice as indicated. Plots are representative of 2 (Myc) or 3 (p27) independent experiments with 2–4 mice per experiment.

