
Figure 6. RelA interactome.
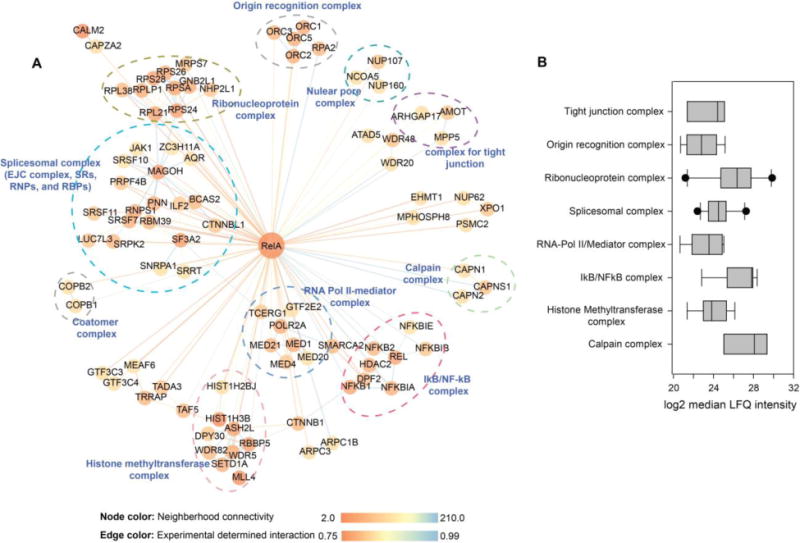
(A) Network representation of RelA interactome. In total, 212 RelA interactors (blue) are represented. The color of each node represents the neighborhood connectivity of each protein. The color of edges corresponds to the MiST score from interactions between RelA and its interactors and also to interactions between RelA interactors that were obtained from publicly available STRING database. (B) Relative abundance of protein complexes that are associated with RelA.