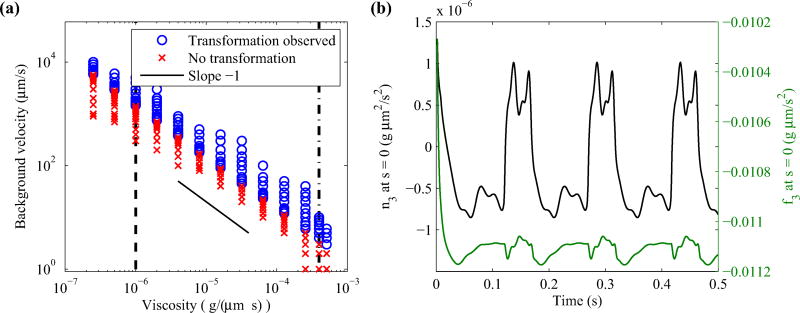
FIG. 10.
(Left) Observed handedness change for various background flow velocity and fluid viscosity. The vertical dashed line and the dashed-dot line denote the viscosity of water and methylcellulose, respectively. Both axes are plotted on a log scale. (Right) Time evolution of n3 and f3 at the motor for flow speed 2000 µm/s. In both plots, the intrinsic torsion is set to τ1 = −2.1472 µm−1 and τ2 = 1.4310 µm−1.

