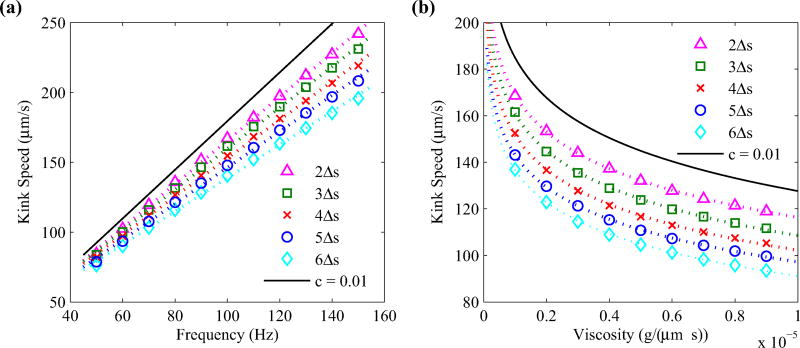
FIG. 12.
Kink propagation speed plotted against motor rotation frequency (left) and fluid viscosity (right) for various regularization parameters c = 2Δs, …, 6Δs. Here, Δs = 0.03 µm, and intrinsic twist values are set to τ1 = −2.1472 µm−1 and τ2 = 2.1472 µm−1. The dotted lines on the left panel denote the lines of best fit, and the dotted curves on the right panel denote a logarithmic best fit curves. The solid curve in each panel estimates the result for c = 0.01 µm based on the best fit parameters.

