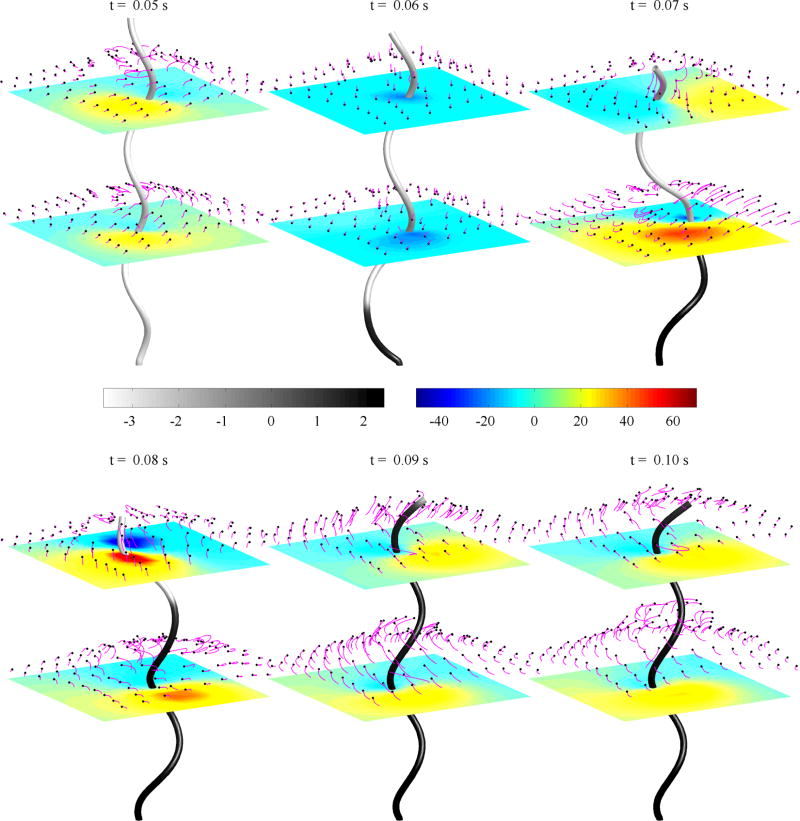
FIG. 4.
Snapshots of a bistable helix with τ1 = −2.1472 µm−1 and τ2 = 1.4310 µm−1, rotating at 100 Hz. The shade of the rod indicates the torsion value where gray is negative (left-handed) and black is positive (right-handed). The horizontal planes show the vertical velocity of the fluid and the markers shown in magenta are passive fluid tracers.

