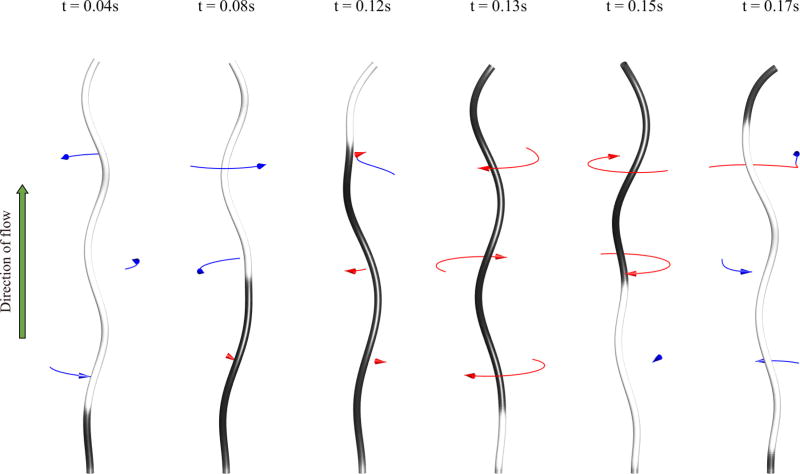
FIG. 8.
Simulation of an experiment by Hotani [17] using intrinsic torsion values τ1 = −2.1472 µm−1 and τ2 = 1.4310 µm−1. Fluid (water) is flowing upward at 2000 µm/s. The shade of the rod indicates the torsion value where gray is negative (left-handed) and black is positive (right-handed). The arrows indicate CW (red) or CCW (blue) rotation and their length is proportional to the motion over the previous 0.008 s.

