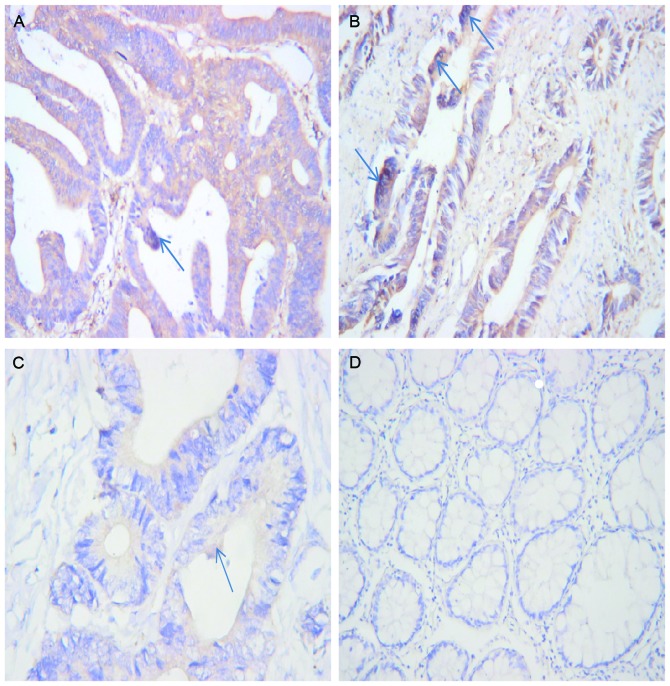
Figure 1.
Expression of CapG protein is increased in CRC tissue relative to non-tumor tissue samples. Representative images of CRC tissue samples with (A) high CapG expression (magnification, ×200), (B) moderate CapG expression (magnification, ×200) and (C) low CapG expression (magnification, ×400). (D) Normal colorectal mucosa cells with negative CapG expression (magnification, ×200). The arrows indicate the distribution of CapG in the cytoplasm and nucleus. CapG, macrophage-capping protein; CRC, colorectal carcinoma.

