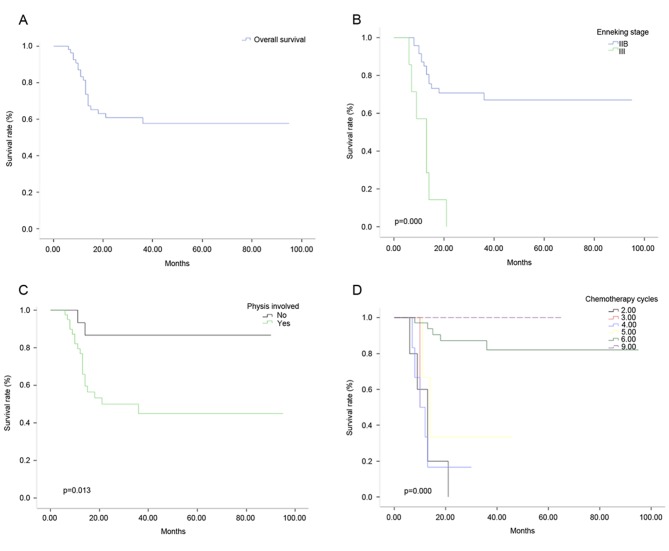
Figure 4.
Overall survival rate with different hazards models. (A) Graph indicating the OS rate of 56 patients. (B) Graph showing different OS rates in patients at Enneking stages IIB and III. (C) Graph showing different OS rates in patients with and without physis. (D) Graph showing different OS rates in patients with 6 and 5 cycles of chemotherapy. OS, overall survival.

