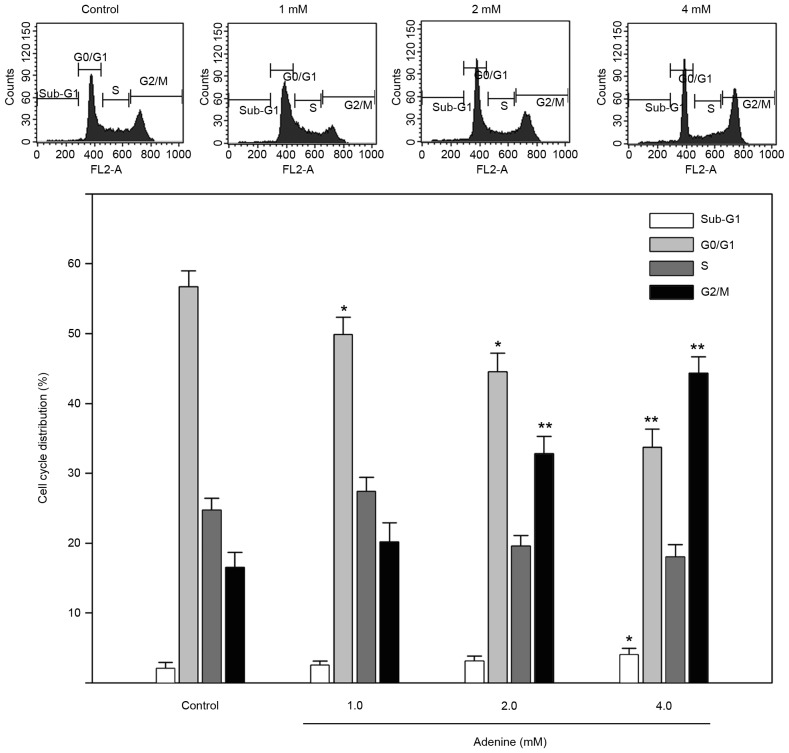
Figure 2.
Effects of adenine on the cell cycle distribution of K562 cells. Cells were treated with 1.0, 2.0 or 4.0 mM adenine for 24 h, and then subjected to flow cytometric analysis for determining cell cycle phases. The ratio of each phase is presented as a percentage. Data are expressed as the mean ± standard error of the mean following three independent experiments. *P<0.05 and **P<0.01 as compared with the untreated control.

