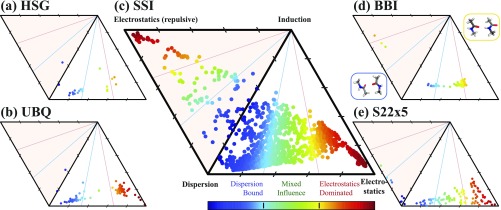
FIG. 2.
SAPT interaction energy decomposition of the four BFDb databases. The relationship between the attractive components—electrostatics, dispersion, and induction—of a SAPT analysis of each member of (a) HSG, (b) UBQ, (c) SSI, and (d) BBI is plotted on a ternary diagram, where proximity to a vertex indicates an accordant fraction of attraction which is due to that component. Database members are colored to differentiate binding motif: hydrogen-bonded (red), mixed-influence (green), and dispersion-dominated (blue). The shaded upper triangle contains complexes supporting a repulsive electrostatics component. Comparison to scanned-coordinate-sampling database S22x5 shown in (e).

