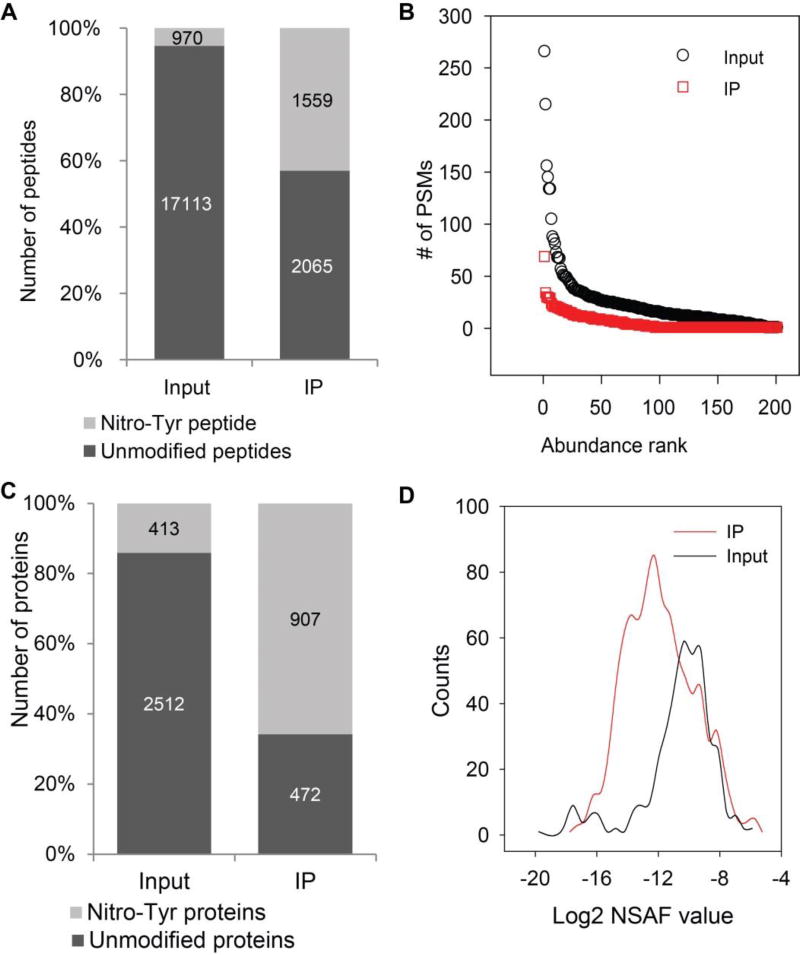
Figure 3.
Enrichment of nitrotyrosine peptides from whole cell lysate of A549 cells. The cell extract was first in vitro nitrated, the proteins were digested and the peptides were subjected for MS analysis before and after anti-nitrotyrosine antibody enrichment. (A) The number of non-nitrated peptides (black) and NT-containing peptides (grey) identified from input and IP enriched fraction. (B) The abundance of the non-nitrated peptides relative to all other identified non-nitrated peptides. Black circles, non-nitrated peptides identified from input; red circles, non-nitrated peptides identified from IP fraction. (C) The number of NT-containing proteins (grey) and non-nitrated proteins (black) identified from input and IP enriched fraction. (D) Histograms of normalized spectra abundance factor (NSAF) for NT-containing proteins identified from input and IP enriched fraction.

