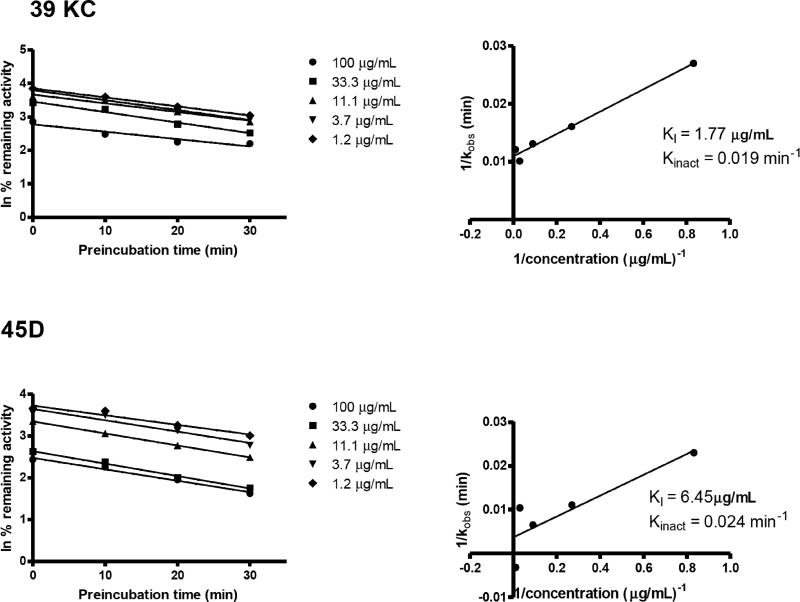
Fig. (8).
Time- and concentration-dependent inhibition of CYP3A4 by 39KC and 45D. Concentrations of fractions are shown on the right of the plots (A). Double-reciprocal plots of kobs and inhibitor concentrations were plotted on linear graph to determine inactivation parameters KI and kinact in plot (B). Each point represents the mean of duplicate determinations.

