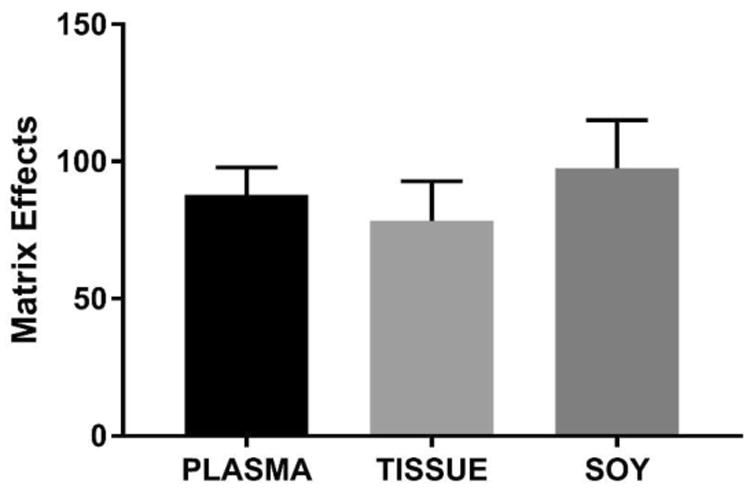
Figure 2. Comparisons of matrix effects of different biological backgrounds.

ME of plasma, tissue and soy homogenates were calculated as described in methods. Average matrix effects were 87.8 ± 10.0, 78.3 ± 14.6, 97.6 ± 17.5% in plasma, tissue and soy, respectively (Average of 6 replicates) and were similar across the different bioological matrices.
