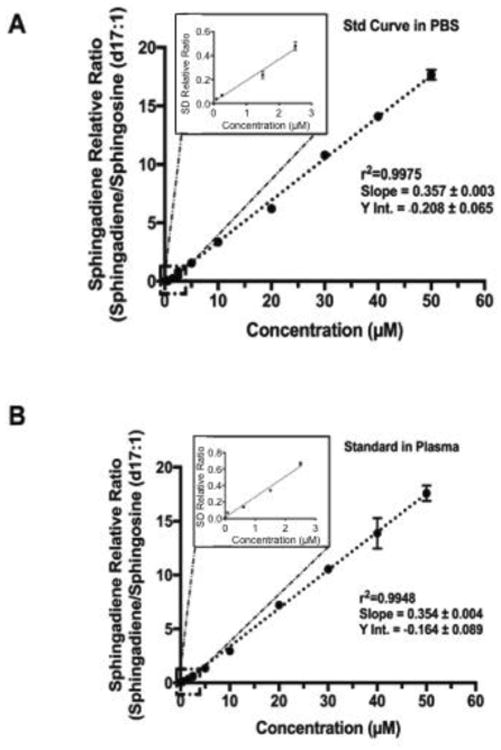
Figure 3. 13 point-calibration curve for SDs in PBS and plasma.

The linearity of SD assay over the concentration ranges of 80 nM to 50 μM are shown. In panel A, the standard curve was created in PBS. Panel B shows the identical curve generated in human plasma matrix. Extraction procedure involves a simple liquid extraction with ethyl-acetate:isopropanol:water mixture followed by collection and drying down of the organic phase. Dried samples are simply reconstituted in methanol. Excellent linearity and similar slope and intercept was observed for both conditions, indicating that the matrix effects of plasma was negligible. The Inset shows the linearity of the assay over the lowest concentration ranges tested.
