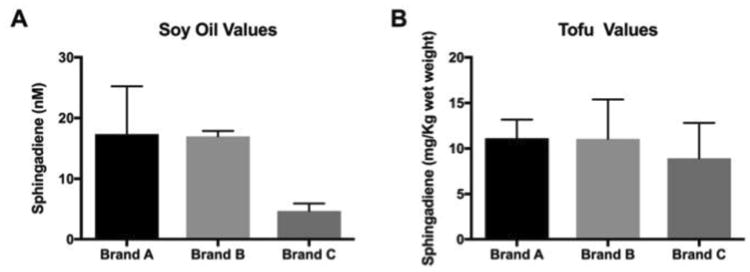
Figure 5. SD concentrations in common soy-based food products.

Panel A shows ranges of SDs quantified in soy oil products ranged from 4.7 to 17.4 μM. Each brand was analyzed in duplicate. Panel B shows ranges of SDs detected in tofu products.

Panel A shows ranges of SDs quantified in soy oil products ranged from 4.7 to 17.4 μM. Each brand was analyzed in duplicate. Panel B shows ranges of SDs detected in tofu products.