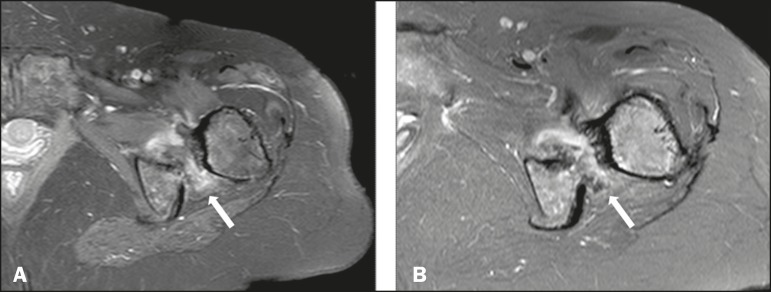
Figure 4.
A: Contrast-enhanced T1-weighted magnetic resonance imaging scan with fat suppression, showing narrowing of the ischiofemoral space and enhancement of the soft tissues in the quadratus femoris muscle region (arrow). B: Axial T2-weighted sequence with fat suppression, showing a pattern of soft-tissue edema interposed between the minor trochanter and the ischial tuberosity (arrow).

