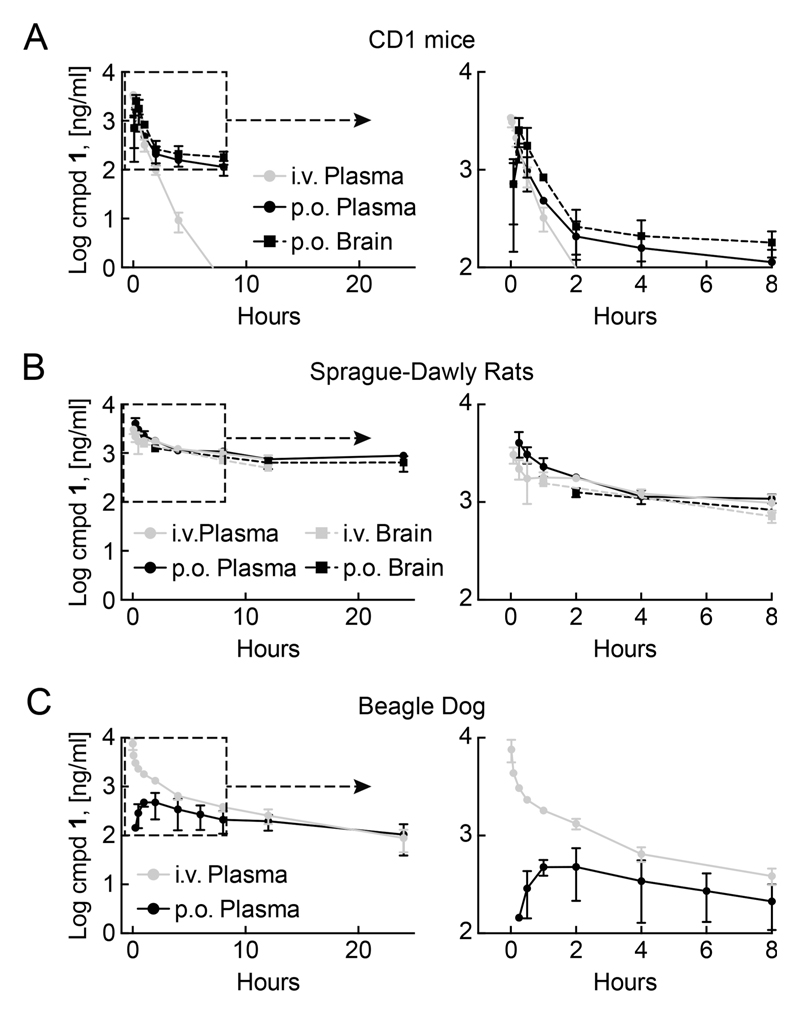
Figure 5.
PK/PD assessment of 1 in mice, rats, and dogs: time course of 1 abundance in vivo. Compound 1 was administered in all species as single dose either per os (po, 10 mg/kg) or via intravenous injection (iv, 5 mg/kg). At indicated time-points 1 was extracted from tissue and its abundance determined using HPLC/MS–MS. (A) Levels of 1 in CD1-mice tissue. Right graph: Zoomed view on early time points, indicated in left graph by dashed square (n = 3, mean ± SD). (B) Concentrations of 1 in tissues from Sprague-Dawly rats. Right graph: Zoomed view on early time points, indicated in left graph by dashed square (n = 3, mean ± SD). (C) Plasma levels of 1 in male Beagle dogs. Panels on the right: zoomed in to dotted line boxes to visualize early time points (n = 3, mean ± SD).

