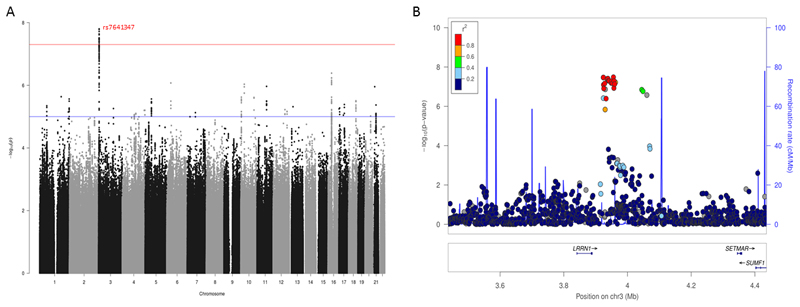
Figure 3. Manhattan plot and regional association plot for the Eyes Test (females) meta-analysis GWAS.
A. Manhattan plot of the Eyes Test meta-analysis (female). X axis is the chromosomal position of the SNP, and Y axis is the negative logarithm of the P-value. The red line indicates genome-wide significant threshold of 5x10⁻⁸. Lead SNP for all loci with P < 1x10⁻⁶ is provided. n = 44,574, and λgc = 1.05. LDSR intercept = 1.05. Regional association plot of the significant locus for the Eyes Test (females) meta-analysis.

