Figure 3. Histological findings.
Figure 3a: H&E sections of Hemopure-perfused livers. A: H&E stained section of part of a large portal tract following 6 hours of perfusion showing normal bile ducts (BD), artery (HA) and portal vein (PV). There is some portal edema present (black arrow) (objective x10). B: H&E stained section showing an intra-parenchymal portal tract with normal bile duct, artery and vein (objective x20). C: H&E stained section of extrahepatic bile duct following 6 hours of perfusion demonstrating normal architecture of the epithelium within the deep peri-biliary plexus (objective x20). D: H&E stained section prior to perfusion showing small droplet steatosis (black arrows) with empty sinusoids (objective x20). E: H&E stained section following 6 hours of perfusion showing a similar degree of small droplet steatosis of hepatocytes (black arrows). The Hemopure fluid fills the sinusoids and central vein and stains pink (objective x20). F: H&E stained section following 6 hours of perfusion and flushing with 2L 10% dextrose showing the Hemopure has been flushed out of the vasculature. The hepatocytes and sinusoids appear normal (objective x20).
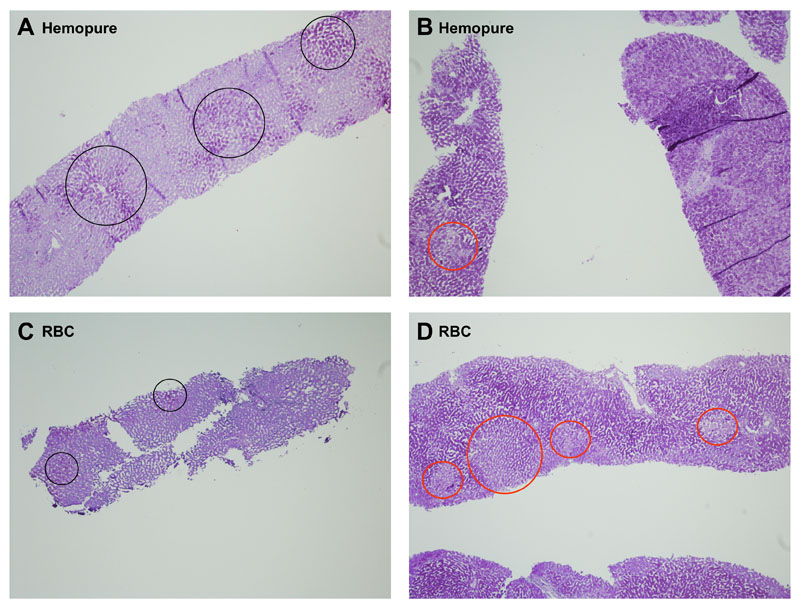
Figure 3b: PAS sections of Hemopure and RBC-perfused livers. A and C: PAS stained section of Hemopure-perfused and RBC-perfused livers respectively, showing marked glycogen depletion prior to perfusion with black circles showing scanty glycogen stores (objective x4). B and D: PAS stained section of Hemopure-perfused and RBC-perfused livers respectively, showing increased glycogen within hepatocytes following 6 hours of perfusion with red circles showing scanty areas which lack glycogen. (objective x4).


