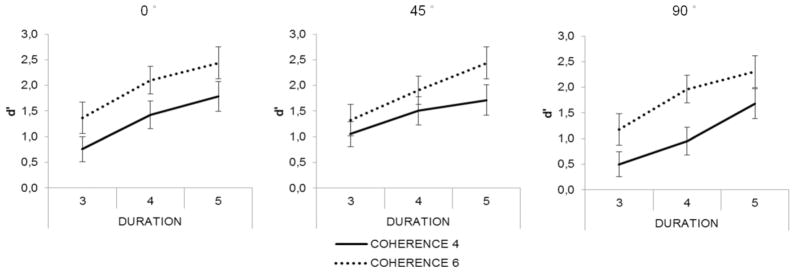
Figure 2.
In Experiment 1, detection improved with increasing figure coherence and increasing figure duration, but was worse when the figure and background were separated by a large spatial separation (see text). Group-averaged (N=20) d’ values (standard error of mean represented by bars) are shown as a function of figure duration separately for the two coherence levels (marked by the different line types). The three levels of location difference between the figure and the ground are shown in the three separate panels.

