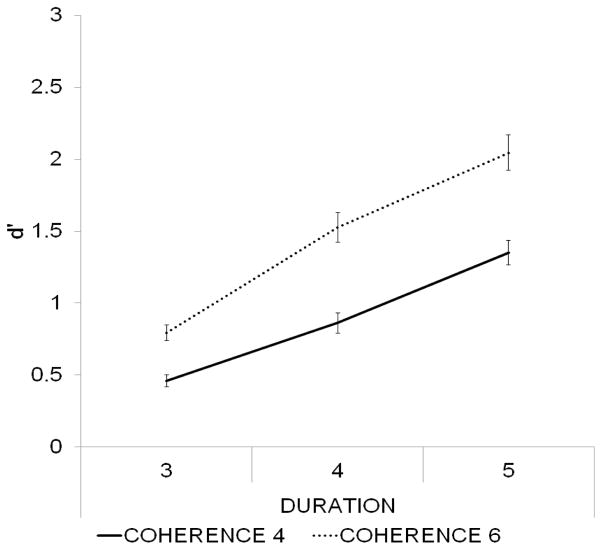
Figure 3.
In Experiment 2, detection improved with increasing figure coherence and increasing figure duration, consistent with Experiment 1. Group-averaged (N=25) d’ values (standard error of mean represented by bars) are shown as a function of figure duration separately for the two coherence levels (marked by the different line types).

