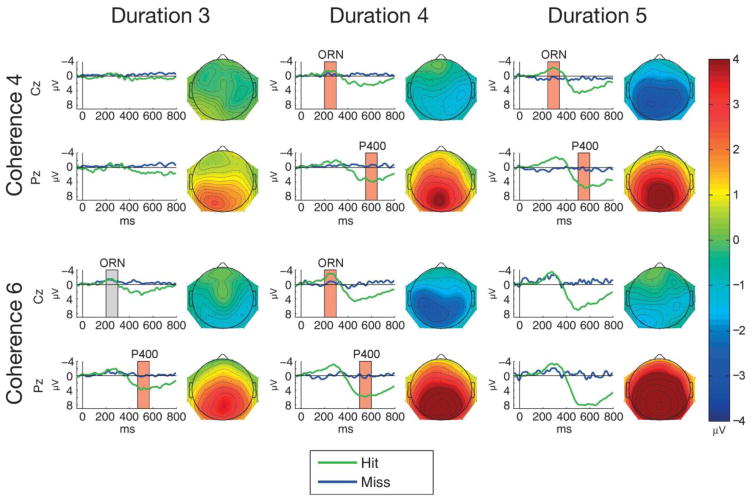
Figure 5.
Group-average (N=25) ERPs elicited for hit (green lines) and miss trials (blue lines) triggered from the figure segment onset (0 ms at the x axis) at Cz (top of each panel) and at Pz (bottom of each panel) for the 6 stimulus types (Coherence: 4 or 6; Duration: 3, 4, or 5. Boxes mark the measurement windows for ORN at Cz and P400 at Pz; a red box indicates significant amplitude difference (p<0.05) between hit and corresponding miss trials within the measurement window, a grey box indicates no significant amplitude difference. Note that due to the low number of hit or miss trials in the Coherence-4/Duration-3 and Coherence-6/Duration-5 conditions, no response amplitudes were measured. The scalp distribution of the mean hit-minus-miss difference amplitudes within the measurement window is shown to the right of each panel. Color calibration is at the right side of the figure.

