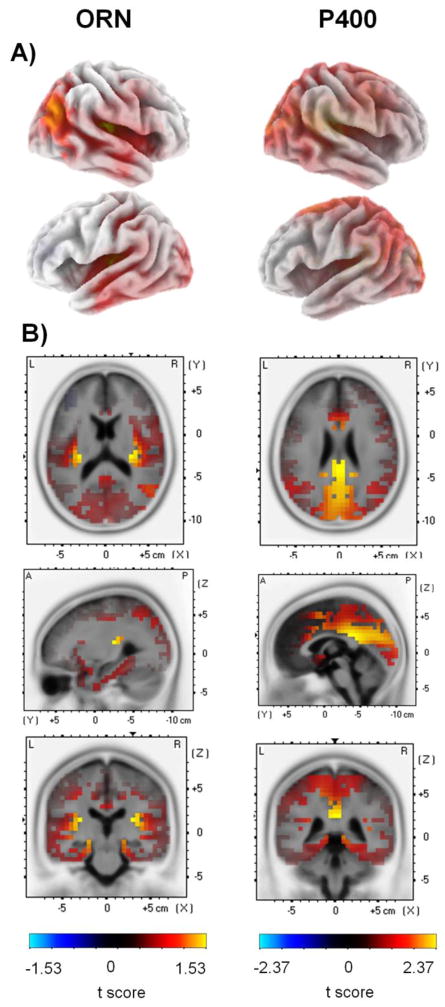
Figure 6.
LORETA t-value maps from voxel-by-voxel paired t-tests contrasting current density values between figure and control stimuli for the ORN (left) and P400 (right) latency range. Red color corresponds to higher current source density magnitudes (indexed by positive t values) for the figure compared to control trials (color scales are at the bottom of the left and right panels). A) Maps are displayed on the 3D inflated cortex. The 3D inflated cortex plots present the right hemisphere on the top and left hemisphere below. B) Maps shown on the MNI152 standard brain template. Coordinates are scaled in cm; origin is at the anterior commissure; (X) = left (−) to right (+); (Y) = posterior ( ) to anterior (+); (Z) = inferior (−) to superior (+). The maps corresponding to the ORN time window (200–350 ms) are shown at the x=−40 mm, y=−25 mm, z=0 mm MNI cordinates; the maps corresponding to the P400 time window (460–600 ms) are shown at the x=30 mm, y=−25 mm, z=15 mm MNI cordinates.

