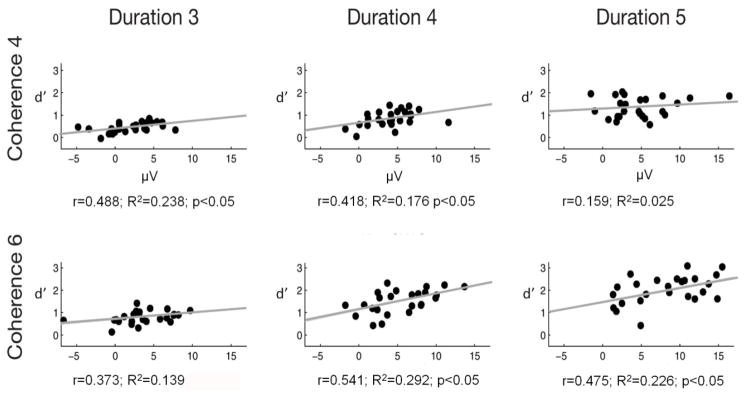
Figure 7.
Across individual subjects, the change in the size of the P400 amplitude difference for hit-miss trials (measured at Pz) correlates with figure-detection peformance (d’) for four of the six stimulus conditions. The dots represent the different listeners’ data. Pearson correlation r values and R2 determination coefficients and p-values are shown on each panel. A regression line is shown on each panel representing the relationship between P400 amplitudes and d’.

