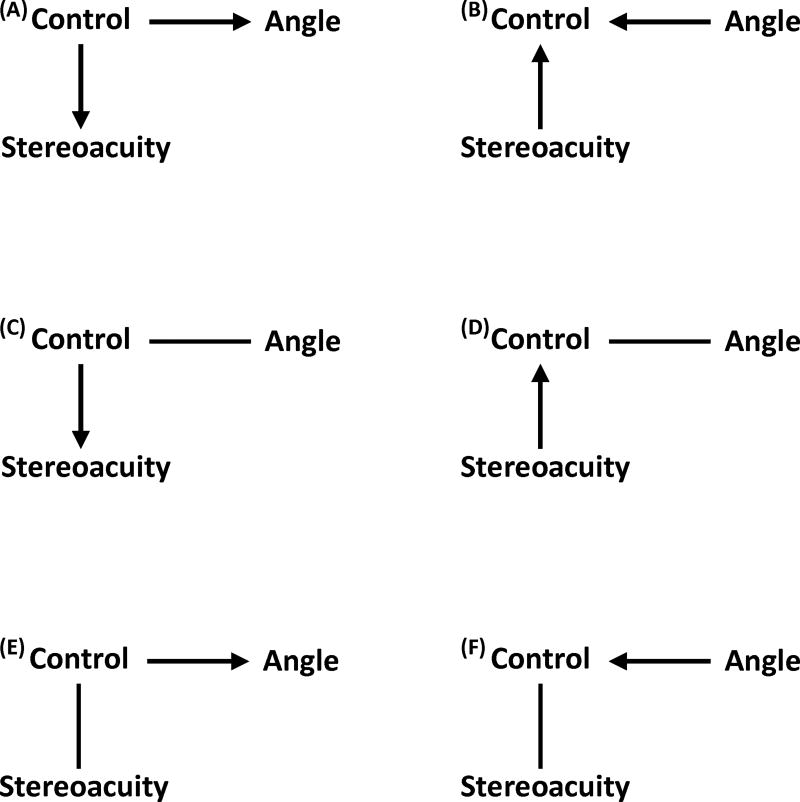
FIG 2.
Suggested relationships between control, stereoacuity, and angle of deviation. The figure displays 6 potential relationships between stereoacuity, control of exotropia (control), and angle of deviation (angle) based on the results. A, Control may influence stereoacuity and angle. B, Angle and stereoacuity may influence control. C, Control may influence stereoacuity and may be noncausally associated with angle. D, Stereoacuity influences control. Control is noncausally associated with angle. E, Control influences angle and is noncausally associated with stereoacuity. F, Angle influences control. Control is noncausally associated with stereoacuity. Lines represent noncausal associations while arrows display causal associations.

