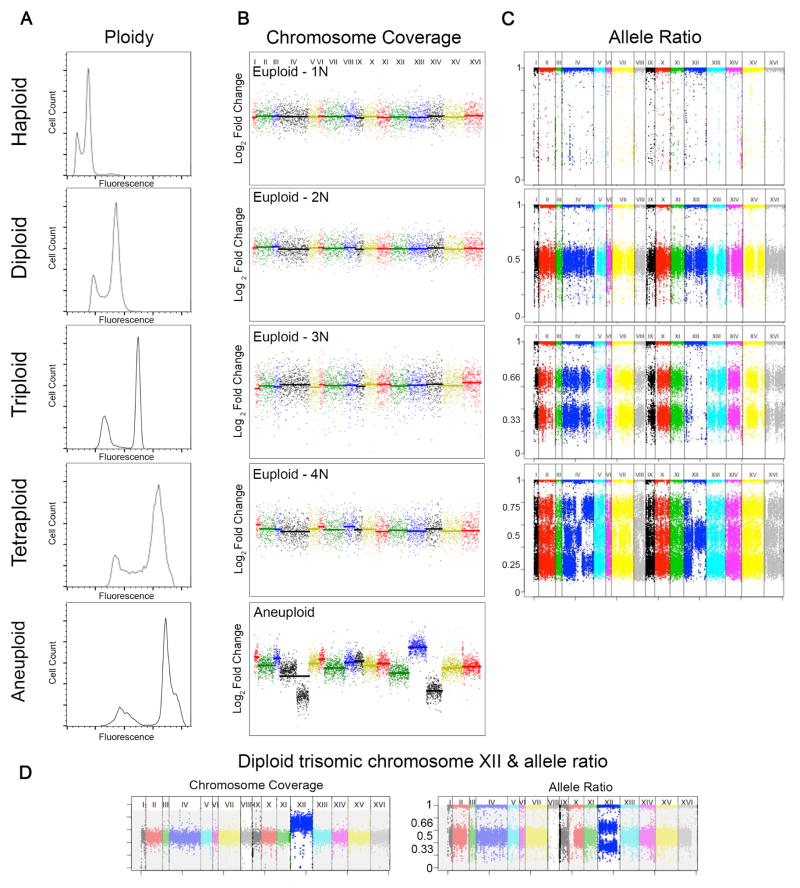
Figure 1. Methods for detection of ploidy and aneuploidy.
A) Ploidy is determined with flow cytometry. Total genome fluorescence, measured using a fluorescent nucleotide label (e.g. propidium iodide or Sytox Green). Cells are first fixed (in ethanol) and RNA is removed with RNase, then gDNA is fluorescently labeled and analyzed on a flow cytometer. Cells are passed through a laser and the number of cells are plotted as a function of fluorescence intensity. Cells in a population typically have two fluorescent peaks, representing cells in either G1 or G2 phases of the cell cycle. Flow cytometry plots for yeast with the following ploidy levels are shown: haploid (1N), diploid (2N), triploid (3N), tetraploid (4N), and a near-tetraploid aneuploid.
B) Chromosome copy number is determined with whole genome sequencing (WGS) and microarray comparative genome hybridization (aCGH). Y-axis represents Log2 fold change of sequence reads relative to reference sequence, and chromosome number increases from left to right starting with chromosome I and ending with chromosome XVI (X-axis). Chromosome copy number plots for S. cerevisiae with the following ploidy levels indicate euploid genome for haploid (1N), diploid (2N), triploid (3N), and tetraploid (4N). However the near-tetraploid isolate (bottom panel) is aneuploid for ChrXII (pentasomic), ChrXIV (trisomic) and contains a segmental aneuploidy of ChrIV. Figures generated from data obtained in (20).
C) Allele frequencies obtained from whole genome sequencing data also can be used to determine the ploidy of a strain. Y-axis is the heterozygous allele frequencies ranging from zero to one, plotted as a function of chromosome number starting with chromosome I and ending with chromosome XVI (X-axis). Allele frequency plot of example haploid strain with SNPs at allele frequencies at 1.0; diploid strain with SNPs at allele frequencies of 0.5 and 1.0; triploid strain with SNPs at allele frequencies of 0.33 and 0.66; and tetraploid strain with SNPs at allele frequencies at 0.25, 0.5, 0.75, and 1.0. Images obtained from reference (16).
D) A diploid strain that is trisomic (three copies of a chromosome) for chromosome XII (left panel). Interestingly, the allele frequency plot has SNPs at allele frequencies of 0.5 and 1.0 for all chromosome except ChrXII, which is at allele frequencies of 0.33 and 0.66, supporting that this chromosome is aneuploid (right panel).

