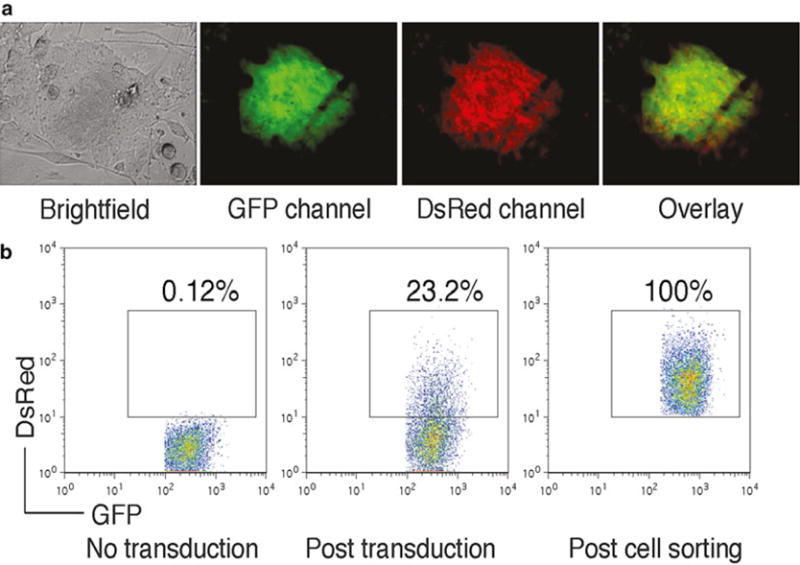
Fig. 1.

(a) FoxP3-transduced iPS cells were visualized by fluorescence microscopy. (b) GFP+ iPS cells (left) were transduced with the retroviral construct, and GFP+ DsRed+ iPS cells (middle) were analyzed by flow cytometry and sorted by a high-speed cell sorter (right)
