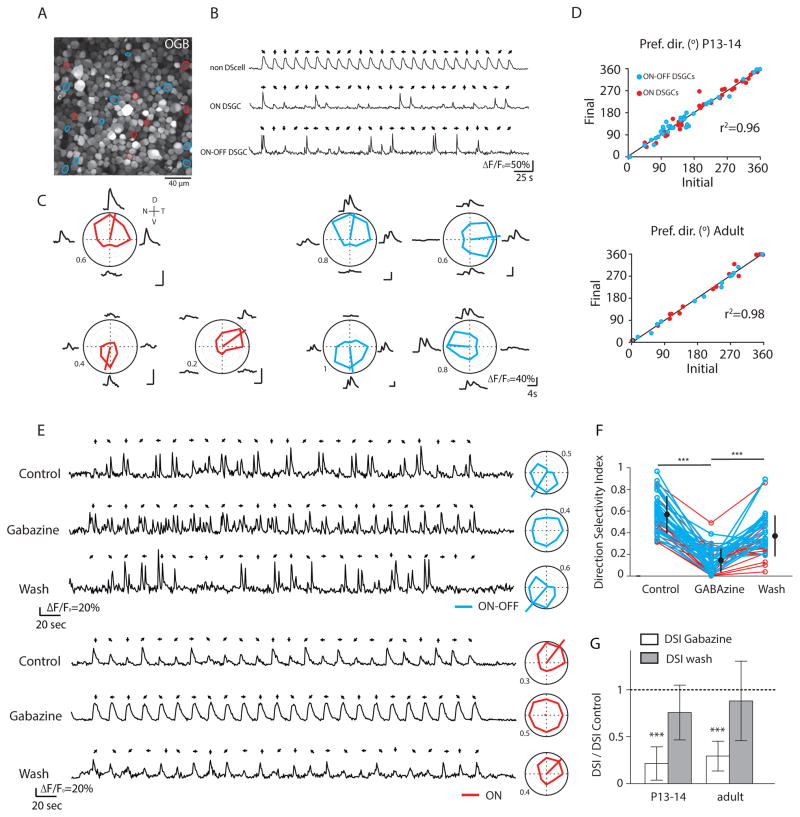
Figure 1. Two-photon calcium imaging reliably identifies both ON and ON-OFF DSGCs in response to UV-drifting bars.
(A) Two-photon fluorescent image of OGB-1 in ganglion cell layer of P13 retina. Red and blue circles indicate ON and ON-OFF DSGCs, respectively.
(B) Examples of OGB-1 calcium signals (ΔF/Fo) in response to a UV bar moving in 8 different directions (black arrows).
(C) Average calcium responses (ΔF/Fo) and tuning curves of three ON DSGCs and four ON-OFF DSGCs from the same field of view in response to a UV-drifting bar. The colored lines inside the polar plots indicate the vector-sum. Numbers around polar plots are indicating the amplitude of calcium signals (ΔF/Fo). V=ventral. N= nasal, D = dorsal, T = temporal
(D) Preferred directions remain stable between two consecutive imaging sessions for both ON (red) and ON-OFF DSGCs (blue) at eye-opening (top, n=73 cells from 3 retinas) and in adult (bottom, n=30 cells from 2 retinas). Pref. dir., preferred direction. r2 indicates the measure of goodness-of-fit of linear regression.
(E) Examples of OGB-1 calcium signals (ΔF/Fo) from an ON-OFF DSGC (top) and an ON DSGC (bottom) in the same field of view from a P14 retina before (top), after 15 minutes bath application of GABAA receptor blocker (GABAzine, 10 μM; middle) and after 30 minutes of rinsing (bottom). Tuning curves for each condition are shown on right.
(F) Direction selective index of ON DSGCs (red) and ON-OFF DSGCs (blue) from P13-14 and adult retinas before, during and after GABAzine application. Black circles and error bars show mean ± SD (*** p<0.001, one-way ANOVA with Tukey post-hoc test).
(G) Summary effects of GABAzine (5–10 μM; white bars) and its rinse (grey bars) on the direction selective index (DSI) as compared to control at eye-opening (left, n=36 DSGCs with 16 ON DSGCs and 20 ON-OFF DSGCs from 2 retinas) and in adult (right, n=20 DSGCs with 12 ON DSGCs and 8 ON-OFF DSGCs from 2 retinas). Means and SD are shown. (*** p<0.001, one-way ANOVA with Tukey post-hoc test). See also Figure S1 and Table S1.

