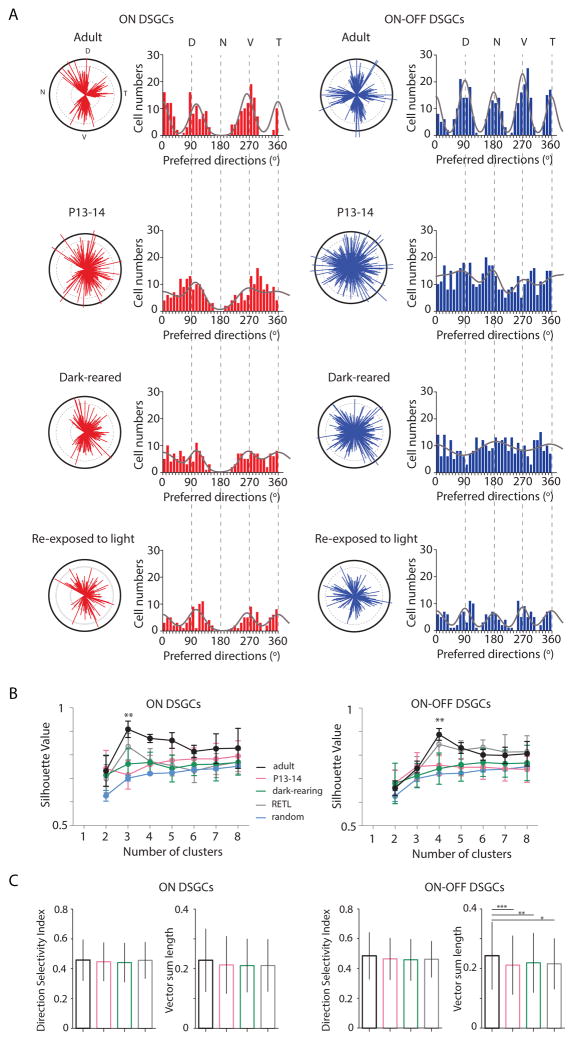
Figure 2. Clustering of the preferred directions of ON and ON-OFF DSGCs along the cardinal axes requires visual experience.
(A) The preferred directions are plotted as polar plots (left) and histograms (right) for ON DSGCs (red) and ON-OFF DSGCs (blue) in adult (top), at eye-opening (middle top), after dark-rearing (middle bottom) and after re-exposure the dark-reared mice to a normal light cycle (12 hr darkness: 12hr light) for 30–50 days (bottom). Solid black lines of polar plots indicate a vector sum length of 0.5 (see Suppl. Information for definition). Solid grey lines on the histograms indicate the von Mises distributions with fixed angles (0°, 105° and 263° for ON DSGCs and 0°, 90°, 180° and 270° for ON-OFF DSGCs).
(B) Average silhouette values as a function of the different cluster numbers for ON DSGCs (left) and ON-OFF DSGCs (right) in adult (black line), at P13-14 (magenta), after dark-rearing (green), after re-exposure to light (grey) and in random distribution (blue). Silhouette values were calculated using k-means clustering analysis of the preferred directions observed in (A). Mean and SD are given for each cluster (** p<0.01, one-way ANOVA with Tukey Post-hoc test).
(C) Direction Selectivity Index and tuning strength represented by the vector sum length of ON (left) and ONOFF (right) DSGCs in adult (black), P13-14 (magenta), dark-reared (green) and dark-reared mice re-exposed to light (grey). Mean and SD are represented (* p<0.05, ** p<0.01, *** p<0.001 one-way ANOVA with Tukey Post-hoc test). See also Figure S2 and S3 and Table S2 and S3.

