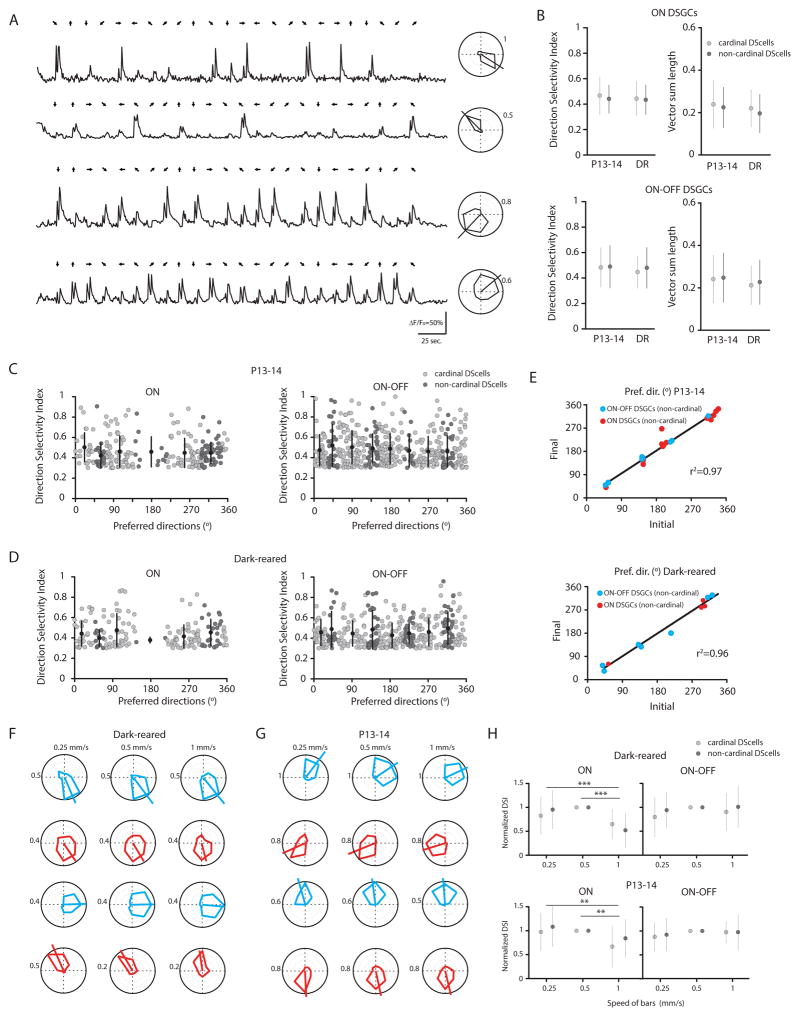
Figure 3. Non-cardinal DSGCs do not display broader direction selective tuning or distinct speed-tuning.
(A) Examples of OGB-1 calcium signals (ΔF/Fo) from four non-cardinal ON-OFF DSGCs in a P13 retina with tuning curves shown at right. Numbers around polar plots are indicating the amplitude of calcium signals (ΔF/Fo).
(B) Direction selectivity index and magnitude of the vector sum of ON DSGCs (top) and ON-OFF DSGCs (bottom) that are aligned (light grey circles, cardinal) or not aligned (dark grey circles, non-cardinal) along the cardinal axes at eye-opening (P13-14, n= 157 cardinal ON DSGCs and n=88 non-cardinal ON DSGCs; n= 330 cardinal ON-OFF DSGCs and n=103 non-cardinal ON-OFF DSGCs from 7 retinas) and after dark-rearing (DR, n=132 cardinal ON DSGCs and n=39 non-cardinal ON DSGCs; n=229 cardinal ON-OFF DSGCs and n=108 non-cardinal ON-OFF DSGCs from 6 retinas). (p>0.05, one-way ANOVA with Tukey post-hoc test). Mean and SD are shown.
(C–D) Direction-selectivity index as a function of the preferred directions of ON DSGCs (left) and ON-OFF DSGCs (right) that are aligned (light grey circles) or not aligned (dark grey circles) along the cardinal axes at P13-14 (n= 245 ON DSGCs and n=433 ON-OFF DSGCs from 7 retinas) and after dark-rearing (n= 171 ON DSGCs and n=337 ON-OFF DSGCs from 6 retinas). Each circle represents one DSGC. Mean and SD are shown.
(E) Preferred directions are stable between two consecutive imaging sessions for non-cardinal ON (red) and ON-OFF DSGCs (blue) at eye-opening (top, n=23 cells from 3 retinas) and after dark-rearing (bottom, n=12 cells from 2 retinas). Pref. dir., preferred direction.
(F–G) Speed tuning of non-cardinal (top) and cardinal (bottom) ON-OFF (blue) and ON (red) DSGCs as assessed by three different bar speeds (left, 0.25 mm/sec.; middle, 0.5 mm/sec.; right, 1 mm/sec.) from adult dark-reared (F) and P13-14 (G) retinas.
(H). Comparison of the speed tuning from cardinal (light grey circles) and non-cardinal (dark grey circles) ON (left) and ON-OFF (right) DSGCs. DSIs were normalized to the value recorded at 0.5 mm/sec in dark-reared (top, n= 37 cardinal ON DSGCs and n=30 non-cardinal ON DSGCs; n= 69 cardinal ON-OFF DSGCs and n=31 non-cardinal ON-OFF DSGCs) and young mice (bottom, n= 19 cardinal ON DSGCs and n=12 non-cardinal ON DSGCs; n= 65 cardinal ON-OFF DSGCs and n=17 non-cardinal ON-OFF DSGCs) (** p<0.01, one-way ANOVA with Tukey Post-hoc test). Mean and SD are shown.

