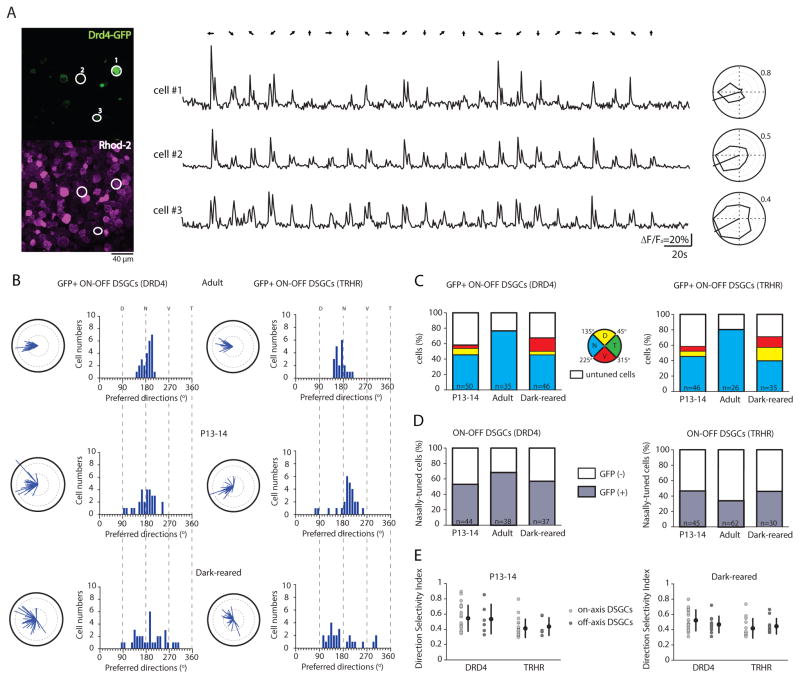
Figure 4. Clustering of GFP+ DSGCs along the cardinal axes occurs by a process of realignment that depends on visual experience.
(A) Two-photon fluorescent images (left) show the GFP signal (top, green channel) and the calcium dye Rhod-2 signal (bottom, red channel) in the ganglion cell layer of a P14 Drd4-GFP mouse. The three white-circled GFP+ ON-OFF DSGCs produce the shown Rhod-2 calcium responses (ΔF/Fo) (middle) and tuning curves (right). All have the same nasally oriented preferred direction. Numbers around polar plots are indicating the amplitude of calcium signals (ΔF/Fo).
(B) Polar plots and histograms of preferred directions for GFP+ ON-OFF DSGCs from DRD4-GFP mice (left) and TRHR-GFP mice (right) in adult (top), at eye-opening (middle) and after dark-rearing (bottom). Solid black lines of polar plots indicate a vector sum length of 0.5 (See Suppl. Information for definition).
(C) Percentage of GFP+ ON-OFF DSGCs (DRD4-GFP line, left; TRHR-GFP line, right) that are nasally (N, blue), dorsally (D, yellow), ventrally (V, red) tuned or untuned (white) at eye-opening (P13-14), in adult and after dark-rearing. Total number of imaged GFP+ cells is given within bars.
(D) Percentage of nasally-tuned ON-OFF DSGCs (DRD4-GFP line, left; TRHR-GFP line, right) that are GFP+ (grey) or GFP- (white) at eye-opening (P13-14), in adult and after dark-rearing. Total number of imaged nasally-tuned DSGCs is indicated within bars.
(E) Direction selectivity index of cardinal (light grey circle) and non-cardinal (dark-grey circle) ON-OFF DSGCs from DRD4-GFP and TRHR-GFP mice at P13-14 (left) and after dark-rearing (right) (p>0.05, Mann-Whitney t-test). Means and SD are shown. See also Figure S4 and Table S4.

