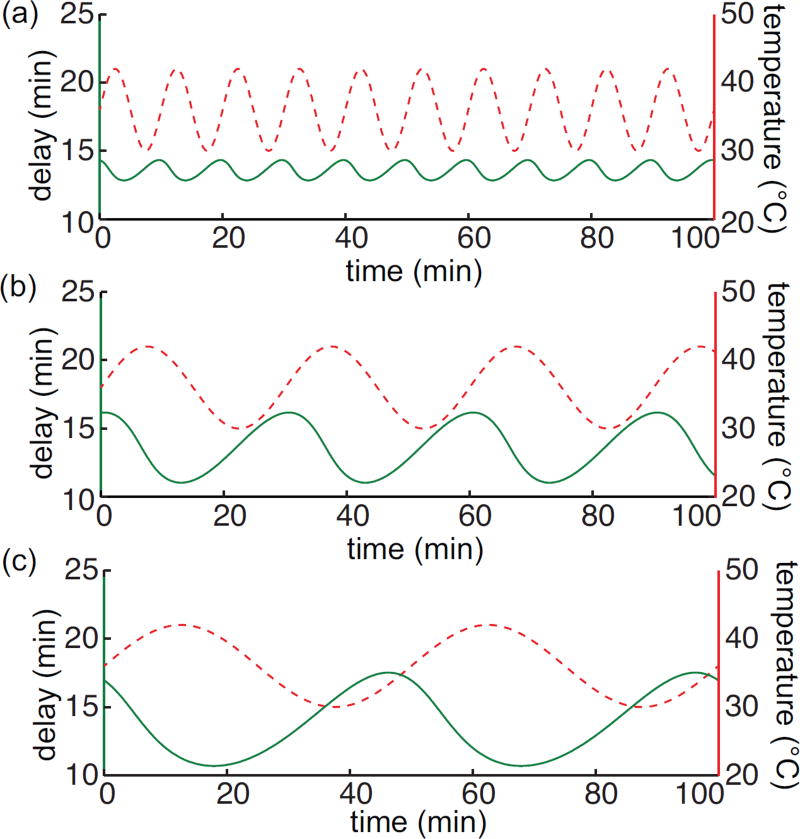
Figure 2.3. Amplitude of the delay changes with the period of the time-varying temperature.
Time-varying delays (green solid lines) corresponding to various time-varying temperature T (t) = ΔT sin(ωt) + T0 (red dashed lines). Parameter values here are θ = 4500K, E = 13.5 min., ΔT = 6°C, T0 = 36°C, and δp = .28. (a) . (b) . (c) .

