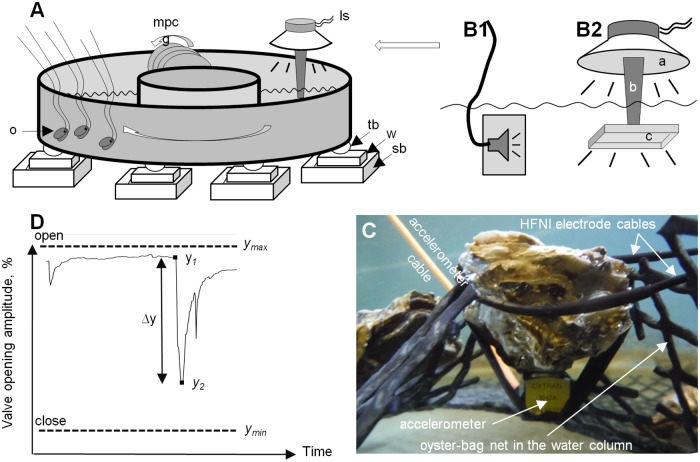
Fig 1. Experimental set-up and quantification of oyster response.
A, schematic view. Is, loudspeaker position; mpcg, multiplate current generator; o, oysters equipped with electrodes; tb, tennis ball; w, wooden board; sb, sandbox; tb, w and sb compose a vibration absorber. B1, commercial loudspeaker to produce tones at frequencies from 80–20000 Hz; B2, laboratory-made loudspeaker for frequencies from 10–80 Hz. D, typical valve closure response and measured values: ymax, daily maximum VOA (valve opening amplitude); ymin, daily minimum VOA; y1, VOA prior to valve closing; y2, minimal VOA during response; Δy, amplitude of the response expressed in %, see the Materials and methods section. C, set-up for shell acceleration measurement.

