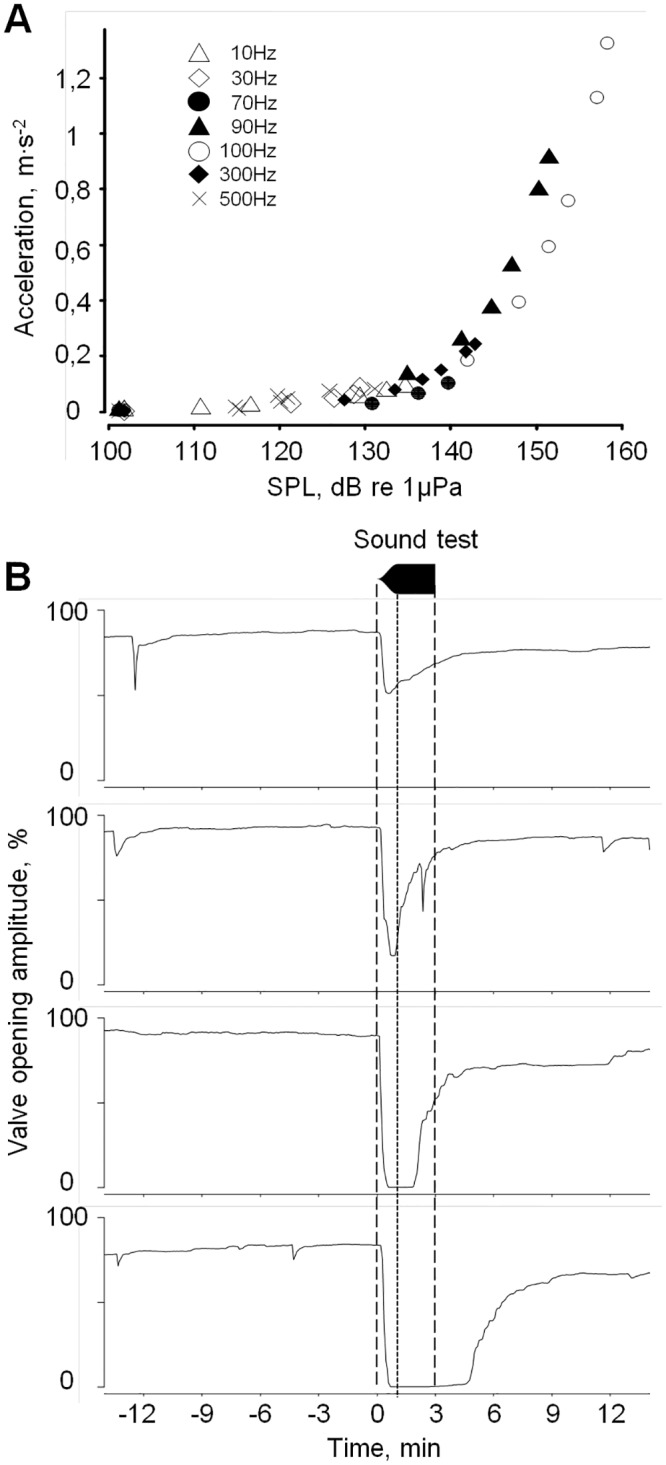
Fig 2. Typical oyster responses to 3 min of pure tone (100 Hz).

A, relationship between shell acceleration and sound pressure level at various frequencies. B, from top to bottom, waveform and typical responses ranging from minimal to maximal responses as a function of time. Dashed lines, onset and offset of the stimulus; dotted line, end of the fade-in period; n = 4 individuals.
