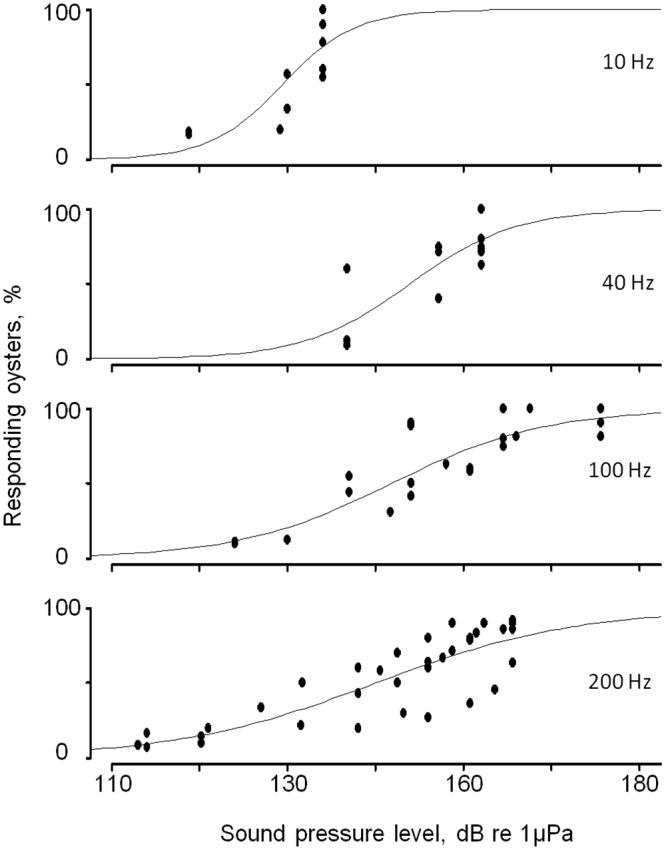
Fig 5. Identifying thresholds at various sound pressure levels for various frequencies.

Four examples of logistic regression models describing the relationship between oyster group responses and sound pressure levels at 10, 40, 100 and 200 Hz. Sound pressure levels are expressed as dBrms.
