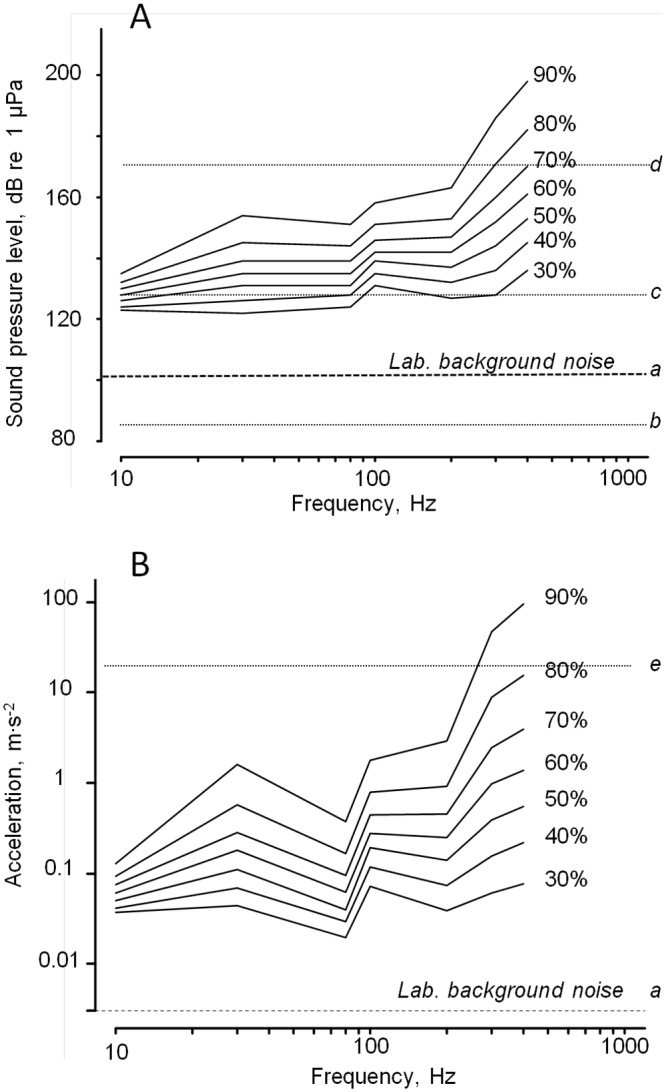
Fig 6. Behavioral thresholds (M. gigas) based on the percentage of responding oysters in a group.

At each sound frequency, the percentage of responding oysters increased with sound pressure level, SPL, and shell acceleration allowing a family of curves to be drawn. A, Relationship among SPL, frequency and percentage of responding oysters. a, b, c and d, are examples of in situ noise recordings (rms; a, background noise under laboratory conditions; b, background noise at Eyrac pier, Bay of Arcachon, France; c, background noise in Poole Harbour, UK [31]; d, noise level produced by a cargo boat at 10 m away [32]. B, Relationship among shell acceleration, frequency and percentage of responding oysters. a, laboratory background noise; e, water motion of breaking waves on a rocky shore [33]. The minimum acoustic energy required to evoke a response increased with frequency.
