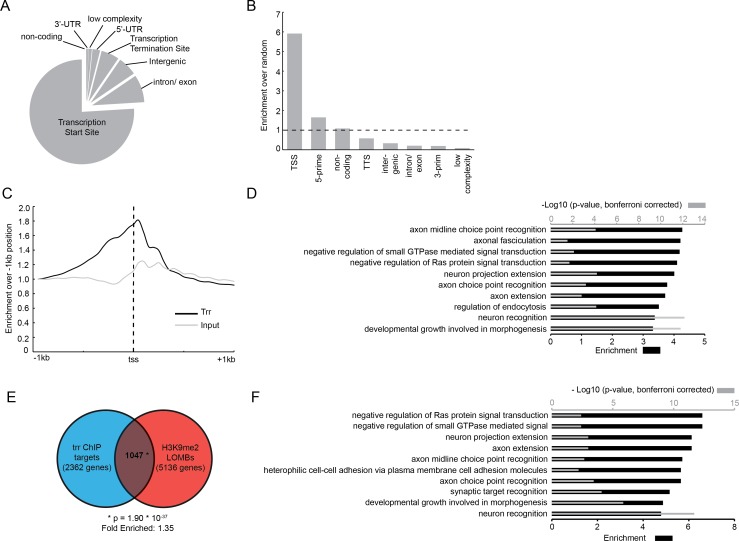
Fig 3. Trr localizes to promoters of neuronal genes in Drosophila heads and shows a significant overlap with G9a targets.
(A) Pie-chart representing the location of trr binding sites in annotated genomic features as specified by HOMER software. (B) Fold enrichment of trr binding sites in annotated genomic features compared to an equivalent group of random genomic positions. (C) Average trr occupancy (black) of all transcription start sites (tss) relative to the –1kb region compared to the average read depth in the input control (grey). (D) Gene ontology enrichment analysis of genes with a trr binding site near the tss. Shown here are the top 10 enriched terms. (E) Venn diagram showing the overlap between predicted trr target genes identified here, and predicted G9a targets that were previously published [18]. The overlap of 1047 genes is larger than expected by random chance, based on a hypergeometric test (p-value = 1.9*10−37 and 1.35 times enriched). (F) Top 10 enriched GO terms for biological processes identified for the 1047 overlapping predicted targets for G9a and trr. For D and F, enrichment is indicated by black bars (lower x-axis), and the –log10 transformation of p-values is indicated by grey bars (upper x-axis).

