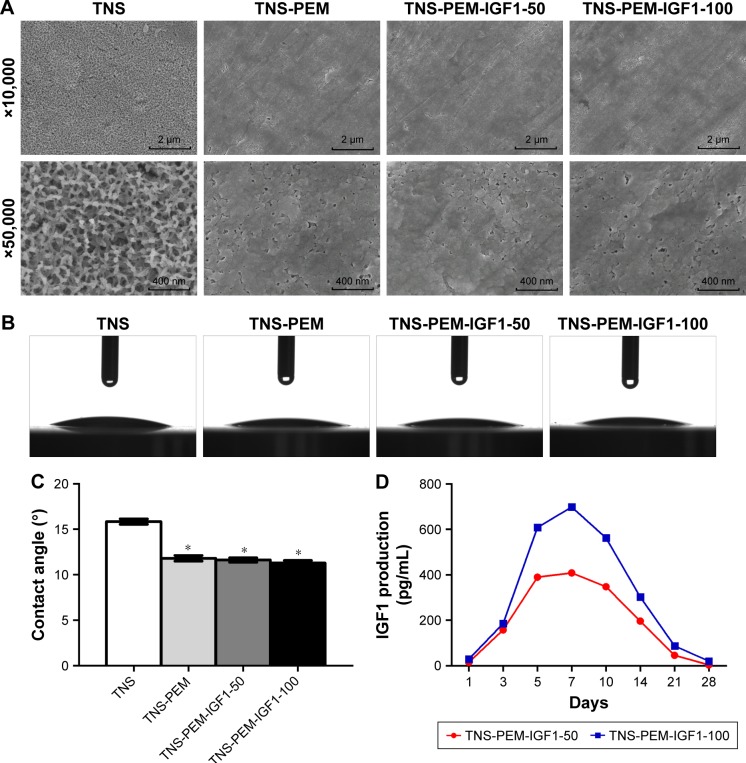
Figure 1.
Surface characterization.
Notes: (A) The scanning electron microscope shows the image before and after the PEM layer is loaded on the specimen surfaces. Contact angle measurements of ultra-pure water droplets pipetted on the specimens. (B) Optical images and (C) quantitative degree results. (D) In vitro release of IGF1. The pictures on the top with a lower magnification of ×10,000 show the overall microscale topography. The pictures at the bottom with a higher magnification of ×50,000 reveal the nanoscale texture. *P<0.05 vs TNS.
Abbreviations: PEM, polyelectrolyte multilayer; TNS, titania nanosheet; TNS-PEM, specimens without IGF1; TNS-PEM-IGF1-50, specimens with 50 ng/mL of IGF1; TNS-PEM-IGF1-100, specimens with 100 ng/mL of IGF1.

