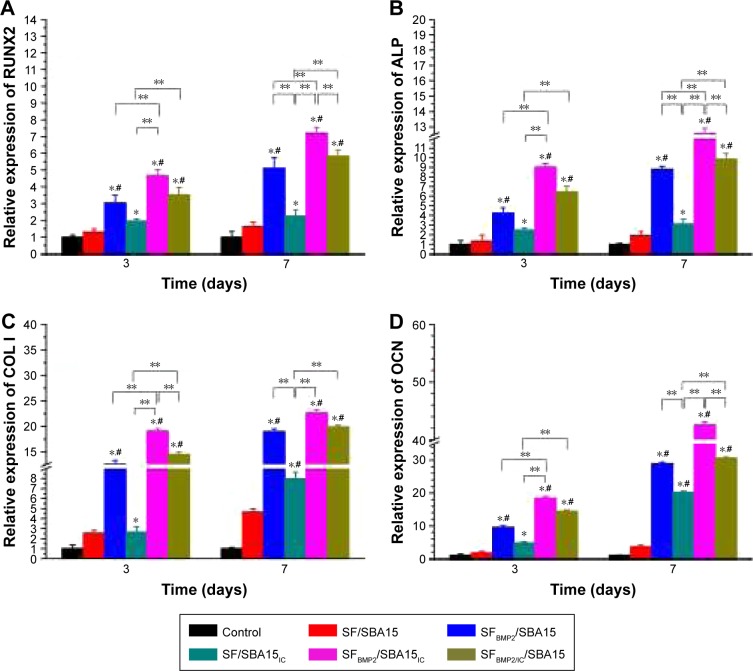
Figure 11.
Relative gene expression levels of osteogenic differentiation markers (A) RUNX2, (B) ALP, (C) COL I, and (D) OCN in rat BMSCs cocultured with different scaffolds at Days 3 and 7. *p<0.05, compared with the control group; **p<0.05, compared with the selected groups; #p<0.05, compared with SF/SBA15 group.
Abbreviations: ALP, alkaline phosphatase; BMSC, bone marrow mesenchymal stem cell; IC, icariin; SF, silk fibroin.

