Figure 6.
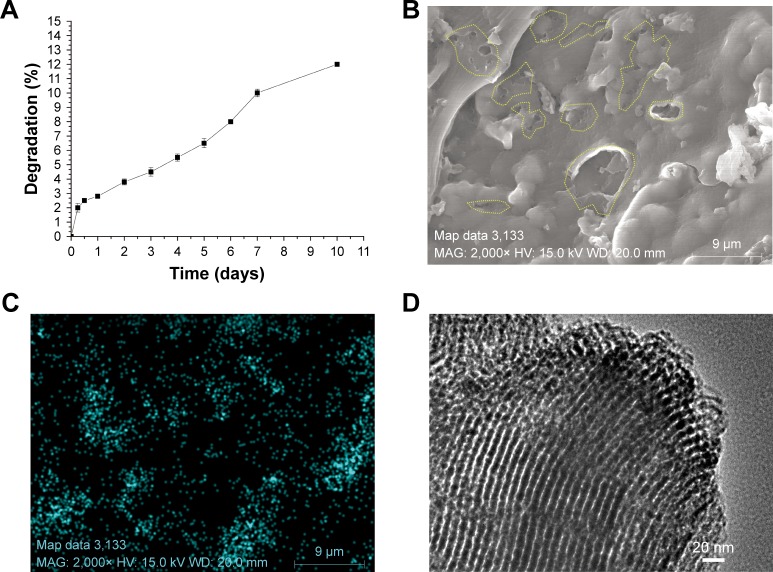
(A) The degradation profile of the SF/SBA15 scaffold over 10 days. (B) Cross-section morphology of the composite scaffold imaged by FE-SEM after 10 days of in vitro degradation study, on which the yellow dotted circles are the newly presented small pores provided by the degradation of the composite scaffold. Silicon elemental distribution (C) on the scaffold surface is mapped by EDS-XRS, and the microstructure of SBA15 (D) in the composite scaffold after 10 days of degradation is shown by TEM image.
Abbreviations: EDS-XRS, energy-dispersive X-ray spectrometry; FE-SEM, field emission scanning electron microscope; SF, silk fibroin; TEM, transmission electron microscopy.

