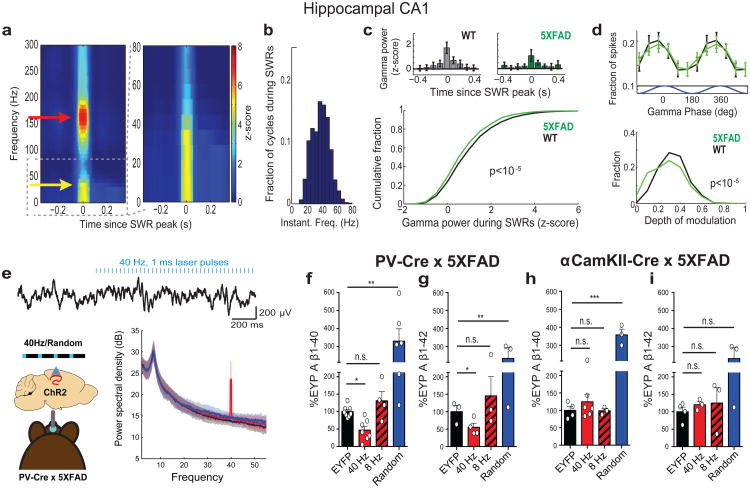
Figure 1. 5XFAD mice have reduced power in gamma during hippocampal SWRs.
a) Average SWR-triggered spectrograms for one mouse (left) showing gamma (yellow arrow) during SWRs (red arrow);right: frequencies below 80 Hz enlarged (n=370 SWRs). b) Histogram of instantaneous gamma frequencies during SWRs for mouse in d. a) Above: Z-scored gamma power around SWR peak for one WT and one 5XFAD mouse (mean ± SEM). Below: Cumulative distribution of gamma power during SWRs (ranksum test, n=2166 and 3085 SWRs in 6 5XFAD and WT mice, respectively). c) Above: Fraction of spikes during SWRs as a function of gamma phase (mean ± SEM). Below: Depth of gamma spiking modulation during SWRs. (ranksum test, bootstrap resampling, n=2500 5XFAD and 3000 WT phase distributions). d) Above: Local field potential trace before and during 40 Hz optogenetic stimulation.Below: Mean and standard deviation of power spectral density (n=4 5XFAD and 3 WT mice). e) Relative A β1-40 levels in CA1 of 5XFAD/PV-Cre mice in each stimulation condition normalized to EYFP controls (n=8 EYFP, n=7 40 Hz, n=4 8 Hz n=6 random mice). f) As in i for A β1-42(n=4 EYFP, n=4 40 Hz, n=3 8 Hz n=3 random mice). g) Relative A β1-40 levels in CA1 of 5XFAD/αCamKII-Cre mice in each stimulation condition normalized to EYFP controls (n=6 40 Hz, n=3 8 Hz n=3 random mice). h) As in k for A β1-42(n=3 mice per group). n.s. not significant, * p<0.05, ** p<0.01, *** p<0.001 by one-way ANOVA; circles indicate n, mean+SEM in bar graphs.

