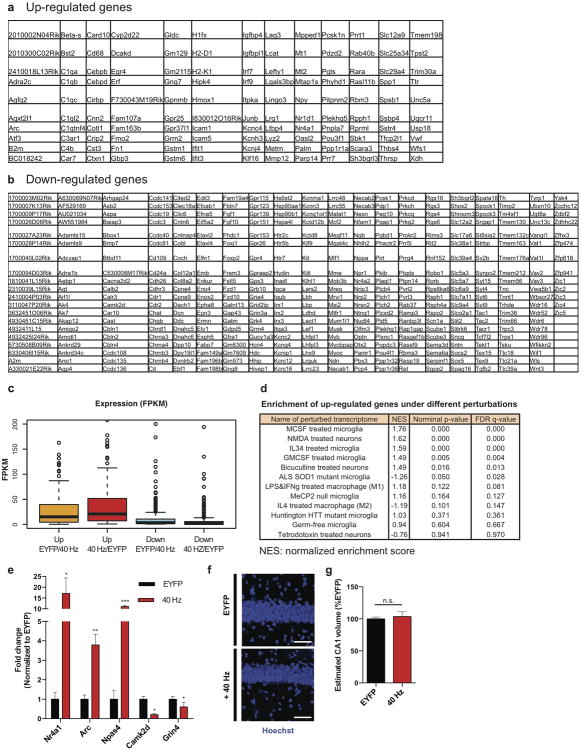
Extended Data Figure 3. Optogenetically driven 40 Hz oscillations in CA1 cause changes in gene regulation and immediate early gene expression.
a) Table of 130 genes up-regulated by 40 Hz FS-PV-interneuron stimulation determined by whole transcriptome RNA-Seq of CA1 from 3-month-old 5XFAD/PV-Cre mice (p<0.05 by Cufflinks 2.2).52
b) Table of 393 genes down-regulated by 40 Hz FS-PV-interneuron stimulation determined by whole transcriptome RNA-Seq of CA1 from 3-month-old 5XFAD/PV-Cre mice (p<0.05 by Cufflinks 2.2).52
c) Box plot showing fragments per kilobase (FPKM) values of up- and down-regulated genes in EYFP and 40 Hz groups. Box shows median (black lines in box) and quartiles (top and bottom of box), whiskers show minimum and maximum values, and circles show outliers.
d) GSEA statistics tables showing statistical significance of correlation between genes up- or down- regulated by 40 Hz stimulation and publicly available neuron, microglia, and macrophage specific RNA-Seq data under different chemical and genetic perturbations; the perturbation terms were ranked based on the FDR q-values for the up-regulated gene list, from the smallest to the largest (Methods).
e) RT-qPCR verification of specific gene targets in the RNA-Seq data set. Bar graph shows relative RNA levels (fold change) from EYFP (black) and 40 Hz stimulation (red) conditions (* indicates p<0.05, ** indicates p<0.01, and *** indicates p<0.001 by Student's t-test, n=3 mice per group). All bar graphs show mean + SEM.
f) Immunohistochemistry with Hoechst to label all cell nuclei in CA1 of 5XFAD/PV-Cre mice expressing only EYFP or ChR2 with 40 Hz stimulation conditions (scale bar = 50 μm).
g) Bar graph represents the estimated CA1 thickness in 5XFAD/PV-Cre mice expressing only EYFP or ChR2 with 40 Hz stimulation conditions (n=4 mice per group; n.s. indicates not significant, by Student's t-test).

