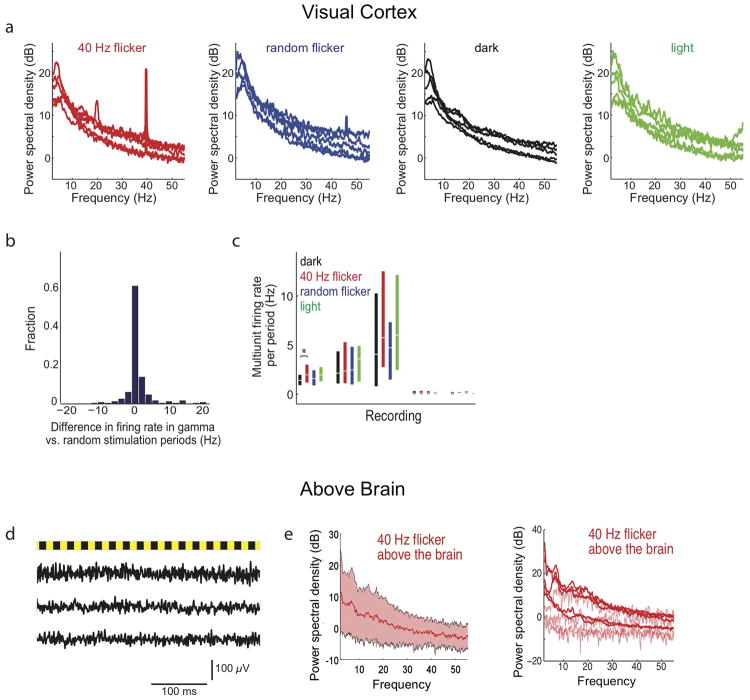
Extended Data Figure 4. 40 Hz light flicker drives 40 Hz oscillations in VC, while random flickering does not.
a) Power spectral densities of local field potentials in VC during 40 Hz light flicker (red, far left), random light flicker (blue, center left), dark (black, center right), or light (green, far right) in VC for each recording session for each mouse (n=5 recordings from 4 5XFAD mice with 47, 51, 64, 49, 16 40 Hz flicker, 47, 50, 64, 50, 16 random flicker, 279, 301, 382, 294, 93 dark and 47, 50, 64, 49, 15 light periods). Light flicker at other frequencies increased power in the flicker frequency, as others have found previously23,24 (data not shown).
b) Histogram of the difference in firing rates between 40 Hz light flicker and random light flicker (n=226 stimulation periods from 5 recording sessions in 4 5XFAD mice).
c) Multiunit firing rates in VC during 40 Hz light flicker (red), random light flicker (blue), dark (black), or light (green) periods. Box plots show median (white lines in box) and quartiles (top and bottom of box). In all animals, firing rates between 40 Hz flicker and random flicker conditions were not significantly different showing that the random stimulation condition serves as a control for spiking activity (ranksum tests for each of 5 recording session from 4 5XFAD mice, p's>0.06, n=47, 51, 64, 49, 16 40 Hz flicker periods and 47, 50, 64, 50, 16 random flicker periods per recording). There were no significant differences in firing rates between 40 Hz flicker and light conditions indicating that 40 Hz light flicker generally did not cause neuronal hyperexcitability (ranksum tests for each of 5 recording session from 4 5XFAD mice, p's > 0.2 for 4 recording sessions, p<0.01 for 1 recording session, which is not significant when corrected for performing multiple comparisons, n=47, 51, 64, 49, 16 40 Hz periods and 47, 50, 64, 49, 16 light periods per recording). In one session, there was more activity in the 40 Hz flicker than in the dark condition.
d) Example traces of LFPs recorded above the brain during light flicker (above, yellow indicates light on, black indicates light off), during three different recording sessions.
e) Power spectral densities of LFPs recorded above the brain during 40 Hz light flicker show no increase in power at 40 Hz. Thus, the effect is not due to photoelectric effects on recording equipment or electrical noise (n= 4, 2,1, 1, 17, 42, 36, 55, 53 40 Hz flicker periods from 4 recording sessions in 3 5XFAD mice undergoing VC recordings and from 5 recording sessions in 2 5XFAD and 3 WT mice undergoing hippocampal recordings). Mean (solid line) and standard deviation (shaded area) across recordings are shown on the left and per animal on the right. Recordings with less than 3 flicker periods (light red) resulted in noisier power spectral densities than recordings with more data (dark red) but none showed evidence of peaks at 40 Hz.

