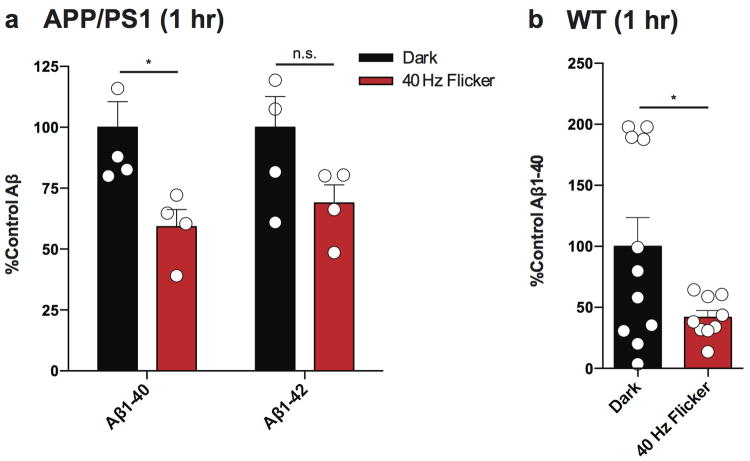
Extended Data Figure 6. Acute reduction in A β after light flicker in APP/PS1 and WT mice and at various time points.
a) Bar graph of relative A β1-40 and A β1-42 levels of APP/PS1 in VC in dark and 40 Hz flicker conditions, normalized to dark (n=5 mice per group for dark and n=4 mice per group for 40 Hz flicker conditions; n.s. indicates not significant and * indicates p<0.05, by Student's t-test). All bar graphs show mean + SEM throughout this figure. Circles superimposed on bars in bar graphs indicate individual data points in each group.
b) Bar graph of relative mouse A β1-40 and Aβ1-42 levels in VC of 9-month-old WT mice in dark and 40 Hz flicker conditions, normalized to dark (n=11 mice per group for dark and n=9 mice per group for 40 Hz flicker conditions; * indicates p<0.05, by Student's t-test).

