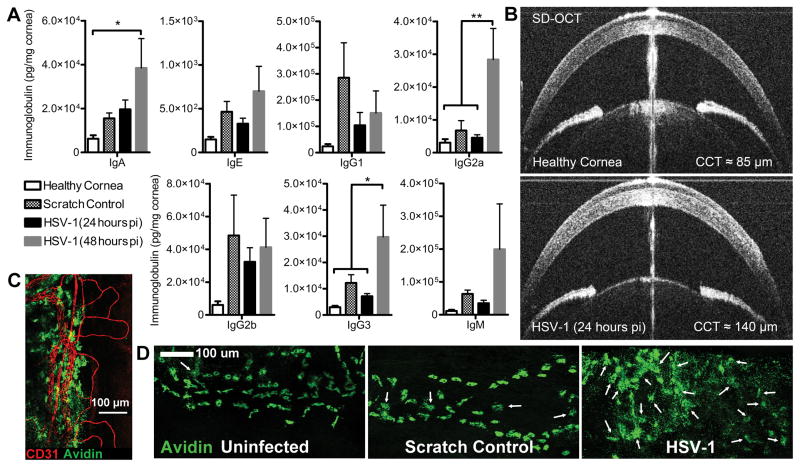
Figure 6. Antibody diffusion dynamics in the cornea following injury or infection.
(A) Concentration of antibody by isotype in corneas from immunologically naive CD-1 mice reflecting healthy, scratch control (24 hours), and HSV-1 infected corneas (n = 6–7 cornea pairs/group; 2–3 independent experiments). Statistical differences were determined by one-way ANOVA with Student-Newman-Keuls multiple comparisons tests. (B) Representative photos from SD-OCT imaging of the anterior segment of healthy and HSV-1-infected eyes showing corneal edema and prominent hyperintensities (leukocytic infiltrates) at 24 hours PI. The central vertical line artifact is a Purkinje-reflection indicative of alignment with the corneal apex, which was used to control for consistency between eyes during image acquisition. (C) Avidin labeled mast cells (green) reside along the cornea-sclera junction in close association with the CD31+ limbal blood vessels (red), image was captured at 20× magnification, scale bar = 100 μm. (D) Confocal images of peri-corneal mast cells at 20× magnification in healthy, scratch control, and HSV-1 infected corneas at 48 hours PI. White arrows point to degranulated mast cells to highlight the widespread degranulation observed following HSV-1 infection; scale bar = 100 μm.

